本文主要是介绍js实现扫描线填色算法使用canvas展示,希望对大家解决编程问题提供一定的参考价值,需要的开发者们随着小编来一起学习吧!
算法原理
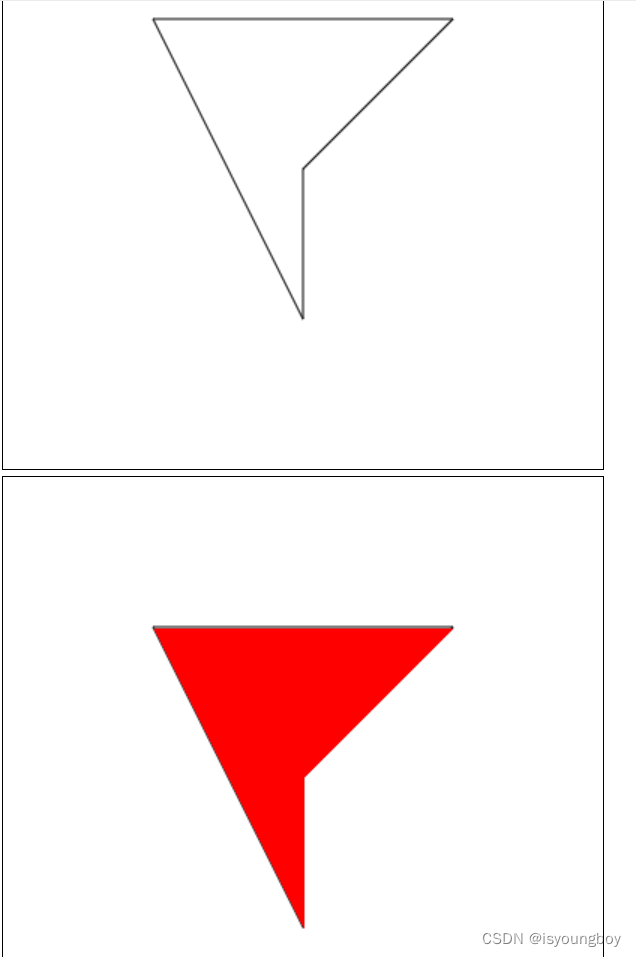
扫描线填色算法的基本思想是:用水平扫描线从上到下扫描由点线段构成的多段构成的多边形。每根扫描线与多边形各边产生一系列交点。将这些交点按照x坐标进行分类,将分类后的交点成对取出,作为两个端点,以所填的色彩画水平直线。多边形被扫描完毕后,填色也就完成。
效果
<!DOCTYPE html>
<html lang="en">
<head>
<meta charset="UTF-8">
<meta name="viewport" content="width=device-width, initial-scale=1.0">
<title>Scanline Seed Fill Algorithm</title>
<style>canvas {border: 1px solid black;}
</style>
</head>
<body>
<canvas id="canvas" width="400" height="400"></canvas>
<br/>
<canvas id="canvasFill" width="400" height="400"></canvas>
<script>// Define the pathconst path = [{ x: 100, y: 100 },{ x: 300, y: 100 },{ x: 200, y: 200 },{x:200,y:300}];// Function to sort points by x-coordinatefunction sortByX(a, b) {return a.x - b.x;}// Function to find minimum and maximum y-coordinate in a list of pointsfunction findMinMaxY(points) {let minY = points[0].y;let maxY = points[0].y;for (let i = 1; i < points.length; i++) {minY = Math.min(minY, points[i].y);maxY = Math.max(maxY, points[i].y);}return { minY, maxY };}// Scanline seed fill algorithmfunction seedFill(canvas, path, fillColor) {const ctx = canvas.getContext('2d');const { minY, maxY } = findMinMaxY(path);const imageData = ctx.getImageData(0, 0, canvas.width, canvas.height);const imageDataArray = imageData.data;for (let y = minY; y <= maxY; y++) {const intersections = [];for (let i = 0; i < path.length; i++) {const p1 = path[i];const p2 = path[(i + 1) % path.length];if ((p1.y <= y && p2.y >= y) || (p2.y <= y && p1.y >= y)) {const x = Math.round(p1.x + (y - p1.y) * (p2.x - p1.x) / (p2.y - p1.y));intersections.push(x);}}intersections.sort((a, b) => a - b);for (let i = 0; i < intersections.length; i += 2) {const x1 = intersections[i];const x2 = intersections[i + 1];for (let x = x1; x <= x2; x++) {const index = (y * canvas.width + x) * 4;imageDataArray[index] = fillColor.r;imageDataArray[index + 1] = fillColor.g;imageDataArray[index + 2] = fillColor.b;imageDataArray[index + 3] = fillColor.a;}}}const canvasFill = document.getElementById('canvasFill');const ctxFill = canvasFill.getContext('2d');ctxFill.putImageData(imageData, 0, 0);}// Draw the pathfunction drawPath(canvas, path) {const ctx = canvas.getContext('2d');ctx.beginPath();ctx.moveTo(path[0].x, path[0].y);for (let i = 1; i < path.length; i++) {ctx.lineTo(path[i].x, path[i].y);}ctx.closePath();ctx.stroke();}// Fill the pathfunction fillPath(canvas, path) {const ctx = canvas.getContext('2d');const fillColor = { r: 255, g: 0, b: 0, a: 255 }; // Red color// Draw the pathdrawPath(canvas, path);// Seed fill the pathseedFill(canvas, path, fillColor);}// Fill the path on canvas loadconst canvas = document.getElementById('canvas');fillPath(canvas, path);
</script>
</body>
</html>
这篇关于js实现扫描线填色算法使用canvas展示的文章就介绍到这儿,希望我们推荐的文章对编程师们有所帮助!


