本文主要是介绍TensorFlow + Keras 入门项目:Classifying Images of Clothing(基于Fashion-MNIST数据集),希望对大家解决编程问题提供一定的参考价值,需要的开发者们随着小编来一起学习吧!
OS:Win10
Interpreter: Python3.7
Environment: Anaconda3 + Tensorflow-gpu2.0.0 + Spyder
Fashion-MNIST 数据集简介:
https://github.com/zalandoresearch/fashion-mnist
'Fashion-MNIST is a dataset of Zalando's article images consisting of a training set of 60,000 examples and a test set of 10,000 examples. Each example is a 28x28 grayscale image, associated with a label from 10 classes.'
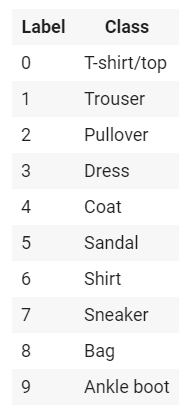
其实就是模仿MNIST数据集(手写数字识别)做的一个简单的衣物(clothing)数据集,有10种类别共70000张带标签的灰度图(28*28),灰度值为[0,255],标签是一个整数数组,值为[0,9],对应关系如下:

Classifying Images of Clothing 项目简介:
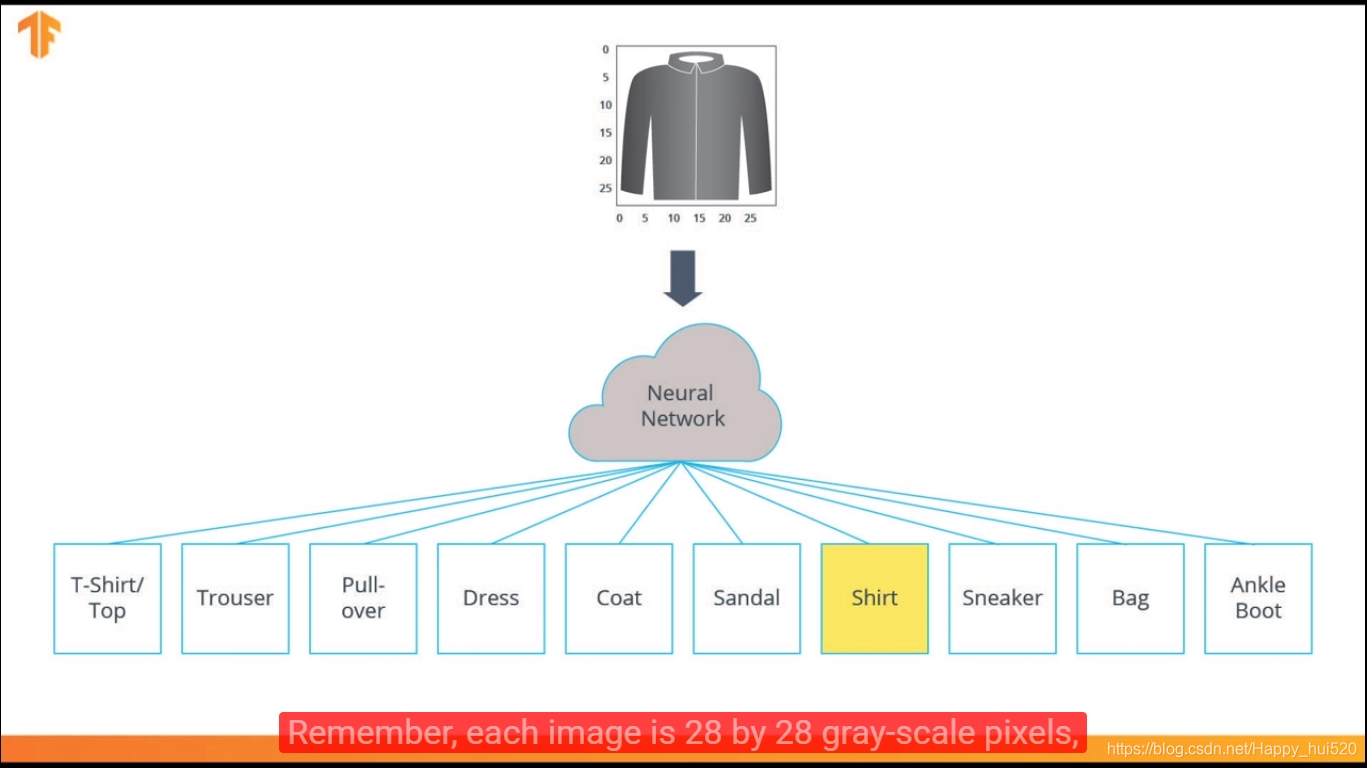
我们要设计和训练一个神经网络,使它在未知的测试集上能达到一个较好的识别准确率。取60000张图片作为Training Data(85.7%),剩余10000张作为Test Data(14.3%)。输入是28*28的灰度图,是10*1的向量,对应10个输出神经元,每个神经元的输出值(activation value)是属于某一类的概率(Probability of each class)。
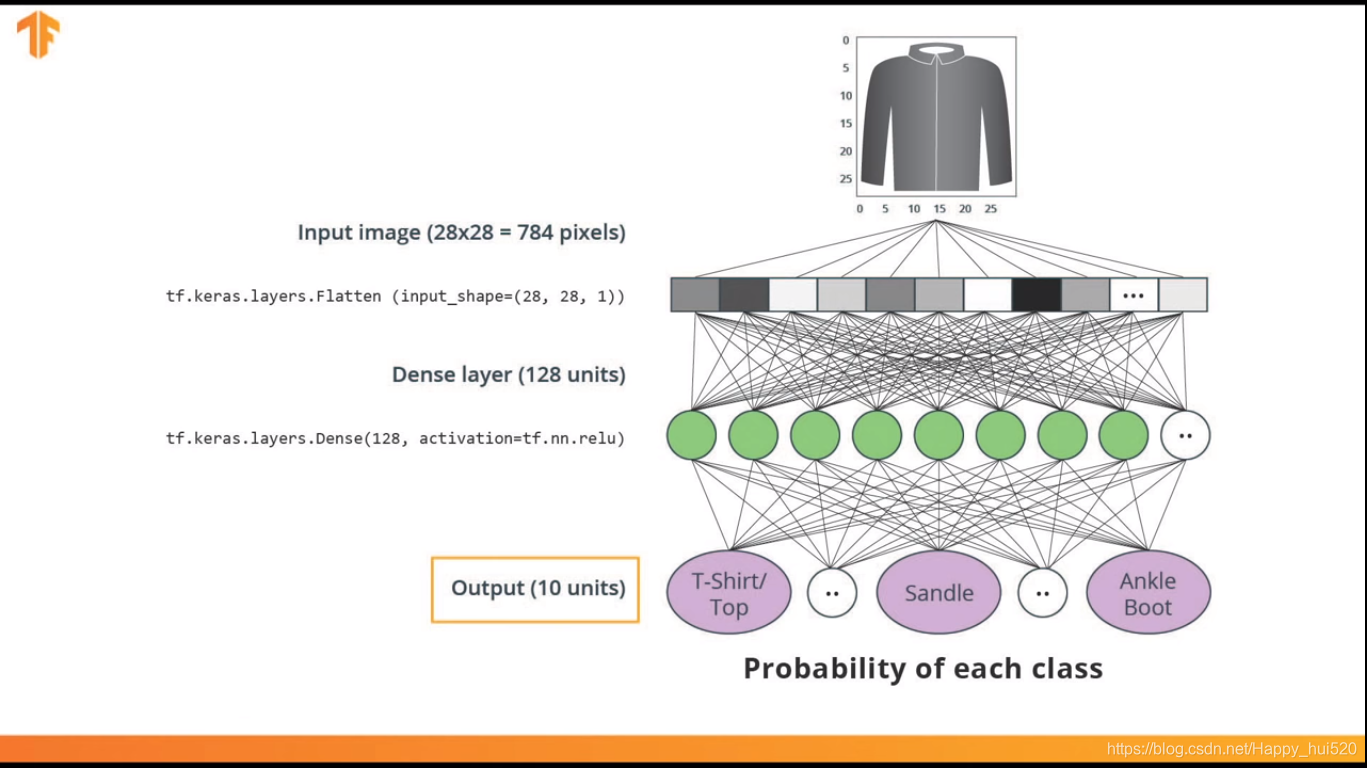
神经网络架构:
输入层:tf.keras.layers.Flatten( input_shape=(28, 28, 1) ) 这一层把2D矩阵(28,28)转为1D向量(784,1)
中间层:tf.keras.layers.Dense( 128,activation=tf.nn.relu ) 采用Relu(线性神经单元),密集全连接层
代码实现:
1.安装和加载依赖项
在命令行里输入,pip会自动下载安装依赖项
pip install -U tensorflow_datasets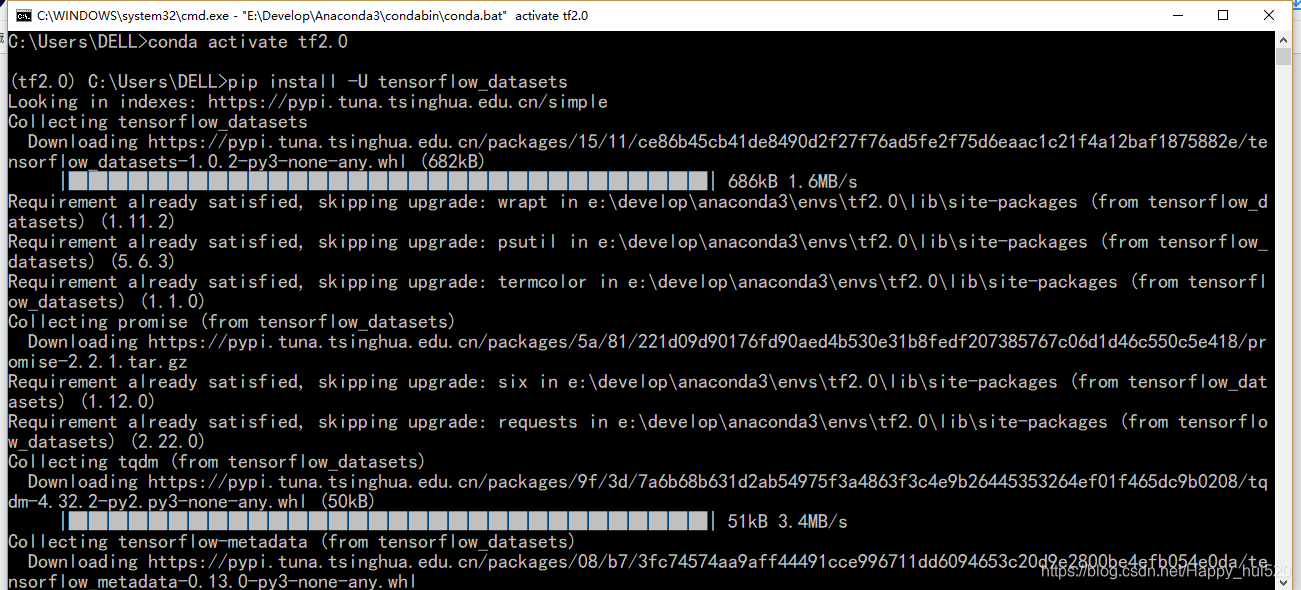

导入相关模块:
# Never mind this statement, for compatibility reasons
from __future__ import absolute_import, division, print_function, unicode_literals# Import TensorFlow and TensorFlow Datasets
import tensorflow as tf
import tensorflow_datasets as tfds
tfds.disable_progress_bar()# Helper libraries
import math
import numpy as np
import matplotlib.pyplot as pltimport logging
logger = tf.get_logger()
logger.setLevel(logging.ERROR) # 只打印ERROR
2. 导入Fashion MNIST 数据集
# 如果之前没下载过,这里会先下载fashion_mnist数据集,
# 然后返回包含tensorflow.python.data.ops.dataset_ops._OptionsDataset对象的字典
#  和tensorflow_datasets.core.dataset_info.DatasetInfo对象
dataset, metadata = tfds.load('fashion_mnist', as_supervised=True, with_info=True)
train_dataset, test_dataset = dataset['train'], dataset['test']class_names = ['T-shirt/top', 'Trouser', 'Pullover', 'Dress', 'Coat', 'Sandal',      'Shirt',   'Sneaker',  'Bag',   'Ankle boot']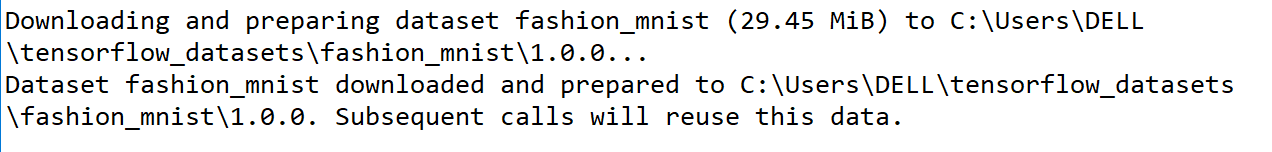
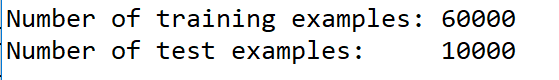
3. 检查数据
num_train_examples = metadata.splits['train'].num_examples
num_test_examples = metadata.splits['test'].num_examples
print("Number of training examples: {}".format(num_train_examples))
print("Number of test examples:     {}".format(num_test_examples))
4. 数据预处理
原图像灰度值是在[0,255],为了使神经网络正常工作,要归一化到[0,1]。
def normalize(images, labels):images = tf.cast(images, tf.float32)images /= 255return images, labelstrain_dataset =  train_dataset.map(normalize)
test_dataset  =  test_dataset.map(normalize)
5. 检查经过处理的数据
# 取一张图片,重标定为(28,28)的格式用于打印
for image, label in test_dataset.take(1):break
image = image.numpy().reshape((28,28))# 画出图片(采用线性分段映射的方式绘图,0为白色,1为黑色)
plt.figure()
plt.imshow(image, cmap=plt.cm.binary)
plt.colorbar()
plt.show()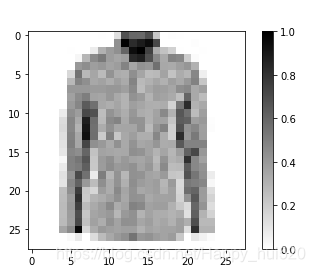
# 显示前25张图片,在每张图片下显示类别
plt.figure(figsize=(10,10))
i = 0
for (image, label) in test_dataset.take(25):image = image.numpy().reshape((28,28))plt.subplot(5,5,i+1)plt.xticks([])plt.yticks([])plt.imshow(image, cmap=plt.cm.binary)plt.xlabel(class_names[label])i += 1
plt.show()

6. 构建模型
a. 建立网络层
model = tf.keras.Sequential([tf.keras.layers.Flatten(input_shape=(28, 28, 1)),tf.keras.layers.Dense(128, activation=tf.nn.relu),tf.keras.layers.Dense(10,  activation=tf.nn.softmax)
])
b.编译模型
model.compile(optimizer='adam', loss='sparse_categorical_crossentropy',metrics=['accuracy'])7. 训练模型
BATCH_SIZE = 32
train_dataset = train_dataset.repeat().shuffle(num_train_examples).batch(BATCH_SIZE)
test_dataset = test_dataset.batch(BATCH_SIZE)model.fit(train_dataset, epochs=5, steps_per_epoch=math.ceil(num_train_examples/BATCH_SIZE))
训练的时候会打印相关信息,包括训练进度、时间、速度、损失、精确度等,可以看到,第一轮训练过后精确度已经达到82.4%部分截图如下:


8. 评估精确度
在测试集上评估精确度
test_loss, test_accuracy = model.evaluate(test_dataset, steps=math.ceil(num_test_examples/32))
print('Accuracy on test dataset:', test_accuracy)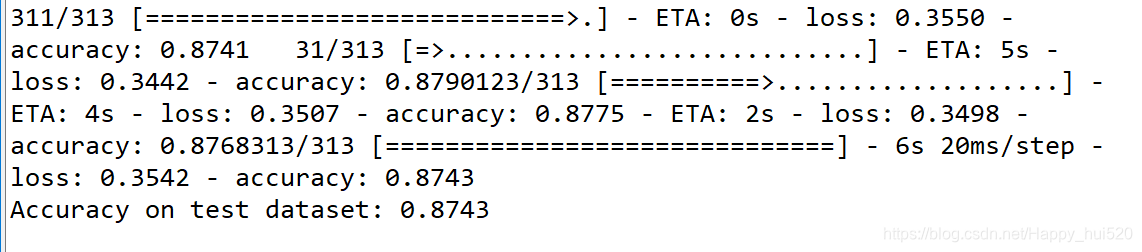
9. 预测和探索
用训练后的模型对一些图片做预测
# test_dataset已经批处理了,所以取出的是32张图片和标签
for test_images, test_labels in test_dataset.take(1):test_images = test_images.numpy()test_labels = test_labels.numpy()predictions = model.predict(test_images)predictions.shape # (32, 10)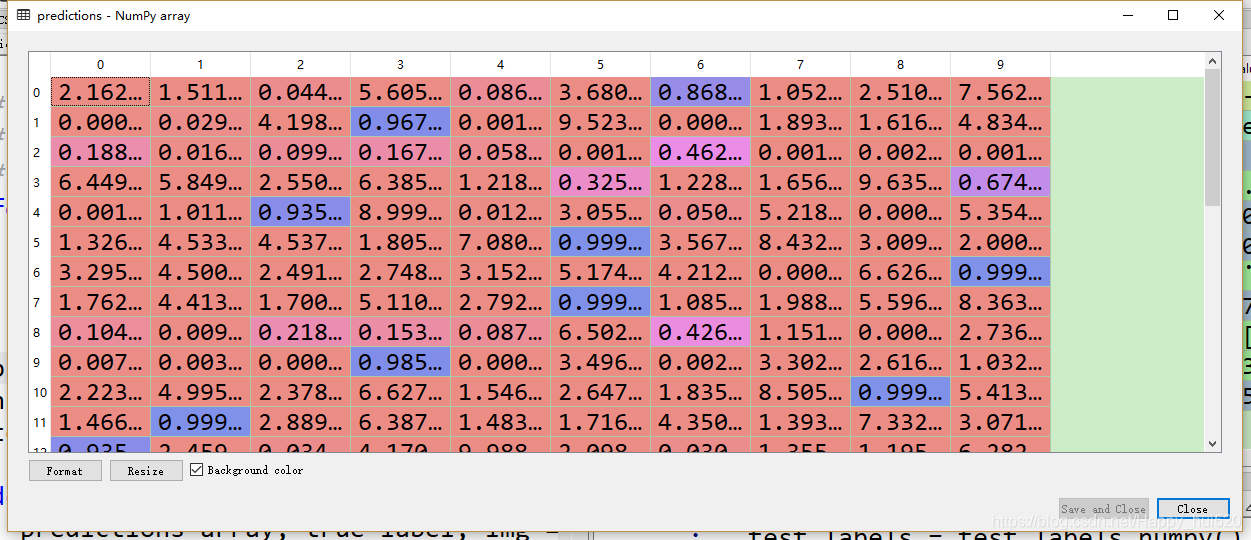
看一下对于第一张图片的预测结果
predictions[0]
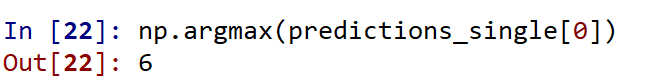
np.argmax(predictions[0]) # 6
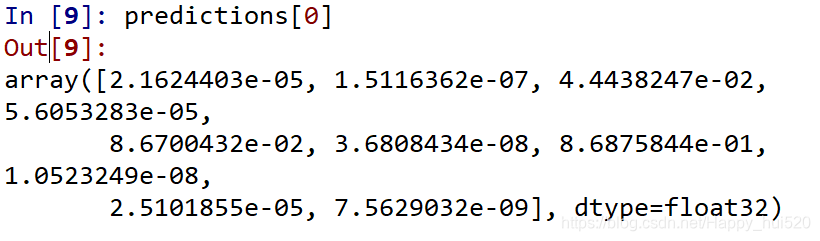
因此,模型最确信此图像是衬衫(数字6对应的标签是shirt),或class_names[6]。我们可以检查一下对应的标签看是否正确:
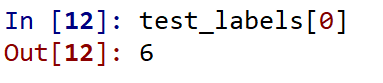 结果一致!
结果一致!
绘图
我们可以画出这幅图来查看完整的10个类别的预测值(直方图形式)
def plot_image(i, predictions_array, true_labels, images):predictions_array, true_label, img = predictions_array[i], true_labels[i], images[i]plt.grid(False)plt.xticks([])plt.yticks([])plt.imshow(img[...,0], cmap=plt.cm.binary)predicted_label = np.argmax(predictions_array)if predicted_label == true_label:color = 'blue'else:color = 'red'plt.xlabel("{} {:2.0f}% ({})".format(class_names[predicted_label],100*np.max(predictions_array),class_names[true_label]),color=color)def plot_value_array(i, predictions_array, true_label):predictions_array, true_label = predictions_array[i], true_label[i]plt.grid(False)plt.xticks([])plt.yticks([])thisplot = plt.bar(range(10), predictions_array, color="#777777")plt.ylim([0, 1]) predicted_label = np.argmax(predictions_array)thisplot[predicted_label].set_color('red')thisplot[true_label].set_color('blue')先看一下第1张图片的预测结果图片和预测值直方图:
i = 0
plt.figure(figsize=(6,3))
plt.subplot(1,2,1)
plot_image(i, predictions, test_labels, test_images)
plt.subplot(1,2,2)
plot_value_array(i, predictions,  test_labels)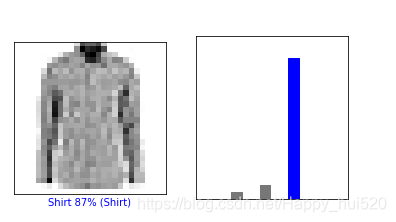
第4张图片的预测结果
i = 3
plt.figure(figsize=(6,3))
plt.subplot(1,2,1)
plot_image(i, predictions, test_labels, test_images)
plt.subplot(1,2,2)
plot_value_array(i, predictions,  test_labels)
看一下前18张图片的预测结果,正确的预测值为标蓝,错误的为标红
# Plot the first X test images, their predicted label, and the true label
# Color correct predictions in blue, incorrect predictions in red
num_rows = 6
num_cols = 3
num_images = num_rows*num_cols
plt.figure(figsize=(2*2*num_cols, 2*num_rows))
for i in range(num_images):plt.subplot(num_rows, 2*num_cols, 2*i+1)plot_image(i, predictions, test_labels, test_images)plt.subplot(num_rows, 2*num_cols, 2*i+2)plot_value_array(i, predictions, test_labels)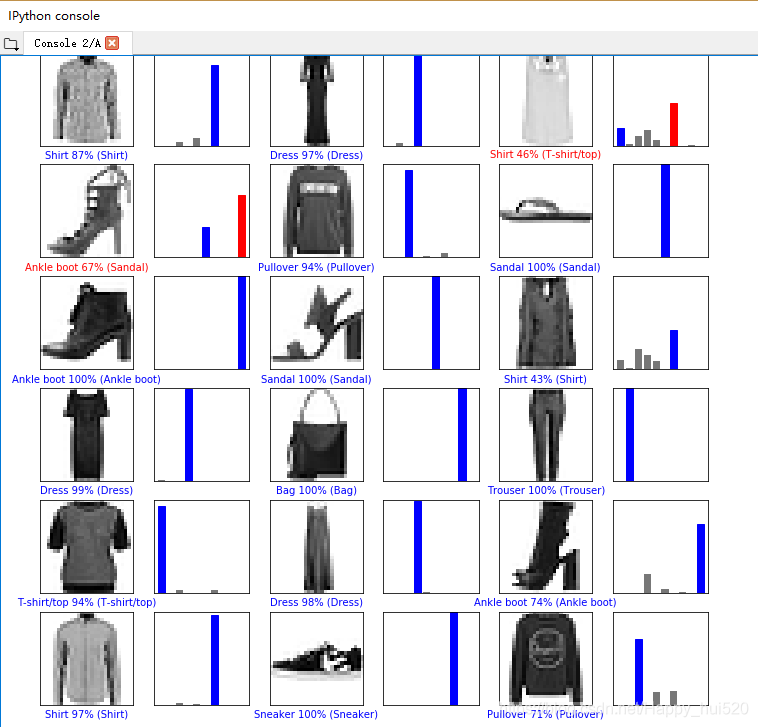
最后,利用训练后的模型对单个图像进行预测
# 从测试数据集中获取图像
img = test_images[0]
print(img.shape)![]()
tf.keras 模型经过优化,可以同时对一批或一组示例进行预测。所以即使我们使用的是一张图片,也需要把它添加到一个列表中:
# 将这张图片作为唯一的成员添加到一个批次里
img = np.array([img])
print(img.shape)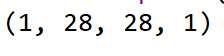
# 预测图片
predictions_single = model.predict(img)print(predictions_single)plot_value_array(0, predictions_single, test_labels)
_ = plt.xticks(range(10), class_names, rotation=45)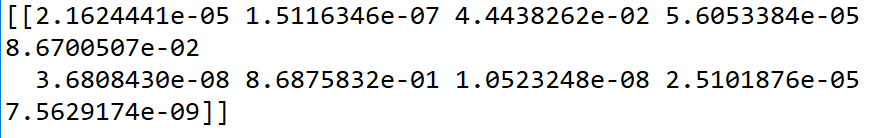

提取预测的标签,和之前结果一样
扩展:
类似于上面这样,你可以把自己制作的图片(28,28)和整理成标准的格式,使用模型进行预测~
练习:
用不同的模型进行实验,看看结果的准确性有何不同。可以试着改变以下参数:
- 将训练的迭代次数(epochs)设置为1
- 平整层(Flatten layer)后面的密集层(Dense layer)中神经元的数量。例如,从非常低的值(例如10)上升到512这个范围内,看看精度如何变化
- 在平整层和最终的密集层(10,activation=tf.n .softmax)之间添加额外的密集层,在这些层中使用不同的units进行实验
- 不要对像素值进行归一化( normalize ),看看效果如何
加油~
这篇关于TensorFlow + Keras 入门项目:Classifying Images of Clothing(基于Fashion-MNIST数据集)的文章就介绍到这儿,希望我们推荐的文章对编程师们有所帮助!


