本文主要是介绍spring boot 项目 prometheus 自定义指标收集区分应用环境集群实例ip,使用 grafana 查询--方法耗时分位数指标,希望对大家解决编程问题提供一定的参考价值,需要的开发者们随着小编来一起学习吧!
spring boot 项目 prometheus 自定义指标收集
auth
- @author JellyfishMIX - github / blog.jellyfishmix.com
- LICENSE LICENSE-2.0
说明
- 网上有很多 promehteus 和 grafana 配置,本文不再重复,只介绍自定义部分。
- 目前只介绍了分位数指标的收集和查询,常用于方法耗时的指标监控。
自定义指标收集
仅引入以下依赖,只能看到 spring actuator 相关指标,看不到自定义指标。
<!-- spring-boot-actuator 依赖 --><dependency><groupId>org.springframework.boot</groupId><artifactId>spring-boot-starter-actuator</artifactId><version>2.7.18</version></dependency><!-- prometheus 依赖,和 spring boot 版本需要搭配。spring boot 2.7 搭配 1.10.x 如需升级或降级 spring boot,可以对应 +- 0.1.0--><dependency><groupId>io.micrometer</groupId><artifactId>micrometer-registry-prometheus</artifactId><version>1.10.6</version></dependency>
application.properties 配置
根据需要自定义调整
spring.application.name=spring-boot-explore
server.port=8083
server.servlet.context-path=/explore
# ip:port/actuator/prometheus
management.server.port=9051
management.endpoints.web.exposure.include=*
management.metrics.tags.application=${spring.application.name}
自定义指标的收集需要引入额外依赖
<!--自定义 prometheus 指标依赖--><dependency><groupId>io.prometheus</groupId><artifactId>simpleclient</artifactId><version>0.16.0</version></dependency><dependency><groupId>io.prometheus</groupId><artifactId>simpleclient_hotspot</artifactId><version>0.16.0</version></dependency><dependency><groupId>io.prometheus</groupId><artifactId>simpleclient_servlet</artifactId><version>0.16.0</version></dependency>
指标收集接口
按照 prometheus 的约定,客户端需要暴露一个接口供收集自定义指标。
import io.prometheus.client.exporter.MetricsServlet;
import org.springframework.stereotype.Controller;
import org.springframework.web.bind.annotation.RequestMapping;
import org.springframework.web.bind.annotation.ResponseBody;import javax.servlet.http.HttpServletRequest;
import javax.servlet.http.HttpServletResponse;
import java.io.IOException;/*** @author jellyfishmix* @date 2024/9/1 08:03*/
@Controller
@RequestMapping("/prometheus")
public class PrometheusExportController extends MetricsServlet {@RequestMapping("/exportMetric")@ResponseBodypublic void exportMetric(HttpServletRequest request, HttpServletResponse response) throws IOException {this.doGet(request, response);}
}
暴露后的自定义指标收集端口,路径是自己配置的:
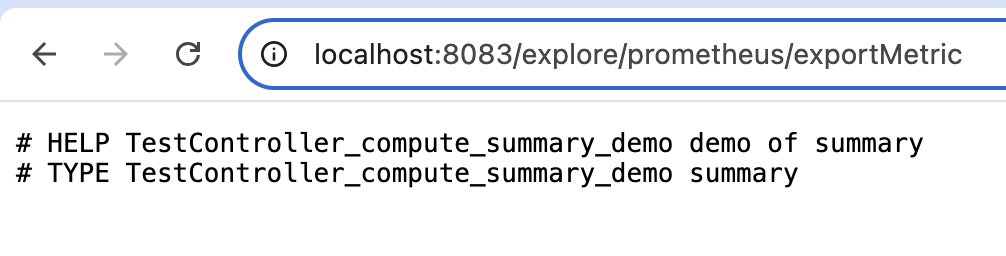
自定义指标示例
private static final Counter DEMO_COUNTER = Counter.build().name("TestController_compute_counter_demo").help("demo of counter").labelNames("labelName1", "labelNameB").namespace("spring_boot_explore").register(DEFAULT_PROMETHEUS_REGISTRY);
namespace 方法
定义指标的前缀,不能包含中划线-,实际指标会带上 namespace 前缀,namespace 与 name 中间自动被下划线_拼接。
spring_boot_explore_TestController_compute_counter_demo
labelNames 方法
使用哦 Summary 举例,说明一下 Counter.build().labelNames() 方法,表示为此指标设置两个 label,分别命名为 labelName1 和 labelNameB。
.labelNames("labelName1", "labelNameB")
如果设置了 Counter.build().labelNames(),不能直接调用 counter.inc(),会抛 NullPointerException
// Convenience methods./*** Increment the counter with no labels by the given amount.** @throws IllegalArgumentException If amt is negative.*/public void inc(double amt) {noLabelsChild.inc(amt);}
需要调用 summary.labels(“abc”, “123”).observe(),labels 方法中的值表示构造 summary 指标时对应的 labelName 的值。
@RequestMapping("/sayCounter")@ResponseBodypublic String sayCounter() {DEMO_COUNTER.labels("abc", "123").inc(1);return "hello summary";}
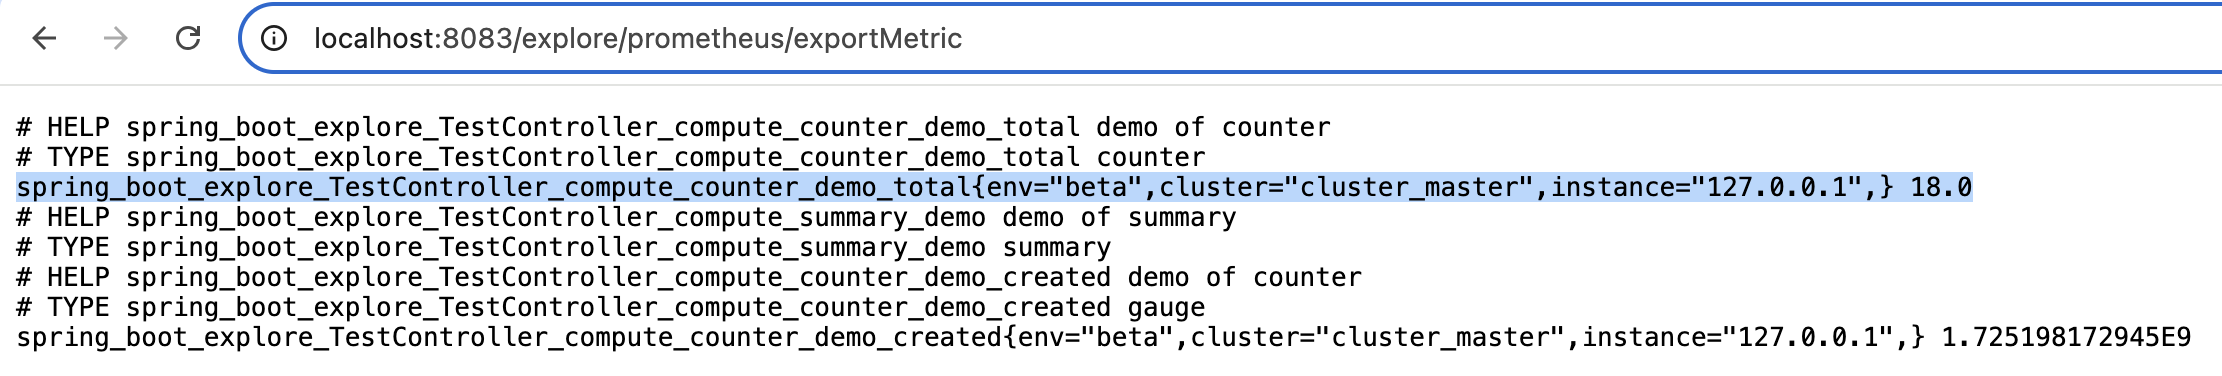
自定义指标区分应用、环境、集群、实例
记录指标的接口
通过 .namespace 和 .labelNames 区分 env 环境名, cluster 集群名, instance 实例信息(一般为ip)
import com.google.common.base.Stopwatch;
import com.jellyfishmix.springbootexplore.server.config.PropertiesLoader;
import io.prometheus.client.CollectorRegistry;
import io.prometheus.client.Counter;
import io.prometheus.client.Summary;
import org.apache.commons.lang3.StringUtils;
import org.springframework.stereotype.Controller;
import org.springframework.web.bind.annotation.RequestMapping;
import org.springframework.web.bind.annotation.ResponseBody;import java.net.InetAddress;
import java.net.UnknownHostException;
import java.util.concurrent.ThreadLocalRandom;
import java.util.concurrent.TimeUnit;@RequestMapping("/test")
@Controller
public class TestController {private static final CollectorRegistry DEFAULT_PROMETHEUS_REGISTRY = CollectorRegistry.defaultRegistry;private static final String applicationName = PropertiesLoader.getProperty("spring.application.name");private static final String env = PropertiesLoader.getProperty("custom.application.env");private static final String cluster = PropertiesLoader.getProperty("custom.application.cluster");private static final Counter DEMO_COUNTER = Counter.build().name("TestController_compute_counter_demo").help("demo of counter")// env 环境名, cluster 集群名, instance 实例信息(一般为ip).labelNames("env", "cluster", "instance")// namespace 应用名.namespace(applicationName).register(DEFAULT_PROMETHEUS_REGISTRY);private static String instance = getLocalIpAddress();public static String getLocalIpAddress() {try {InetAddress localHost = InetAddress.getLocalHost();return localHost.getHostAddress();} catch (UnknownHostException e) {e.printStackTrace();return StringUtils.EMPTY;}}@RequestMapping("/sayCounter")@ResponseBodypublic String sayCounter() {// 对应 .labelNames 中的 env 环境名, cluster 集群名, instance 实例信息(一般为ip)DEMO_COUNTER.labels(env, cluster, instance).inc(1);return "hello counter";}
}
application.properties 配置,注意 prometheus 指标 namespace 不能用-,需要用_
spring.application.name=spring_boot_explore
custom.application.env=beta
custom.application.cluster=cluster_master
server.port=8083
server.servlet.context-path=/explore
由于 properties 配置无法通过 @Value 在静态方法/字段获取值,因此需要手动加载配置文件来获取 properties 值。
import org.apache.commons.lang3.StringUtils;
import java.io.FileInputStream;
import java.io.InputStream;
import java.lang.management.ManagementFactory;
import java.util.LinkedHashMap;
import java.util.Map;
import java.util.Properties;/*** @author jellyfishmix* @date 2024/9/1 18:45*/
public class PropertiesLoader {private static Map<String, String> propertiesMap = new LinkedHashMap<>();/*** jvm 启动参数中指定 active profile*/private static final String ACTIVE_PROFILE_JVM_ARG_KEY_WORD = "spring.profiles.active=";static {load("application.properties");String activeProfile = null;// 先检查 jvm active profilevar jvmArgs = ManagementFactory.getRuntimeMXBean().getInputArguments();for (String arg : jvmArgs) {if (arg.contains(ACTIVE_PROFILE_JVM_ARG_KEY_WORD)) {int index = arg.indexOf("=");if (index!= -1) {activeProfile = arg.substring(index + 1);}break;}}// jvm 参数未指定 active profile,再尝试使用 application.properties 中指定的if (StringUtils.isEmpty(activeProfile)) {activeProfile = propertiesMap.get("spring.profiles.active");}if (StringUtils.isNotBlank(activeProfile)) {load("application-" + activeProfile + ".properties");}}public static void load(String fileName) {final Properties properties = new Properties();FileInputStream fis = null;InputStream is = null;// 两种加载方式,第一种根据文件路径加载try {fis = new FileInputStream(fileName);properties.load(fis);} catch (Throwable ignored) {// 如果失败了,使用类加载器去 classpath 加载try {final ClassLoader classLoader = PropertiesLoader.class.getClassLoader();is = classLoader.getResourceAsStream(fileName);properties.load(is);} catch (Exception ex) {// can record logreturn;}} finally {try {if (fis != null) {fis.close();}if (is != null) {is.close();}} catch (Throwable ignored) {// do nothing}}propertiesMap.putAll(new LinkedHashMap<String, String>((Map) properties));}public static String getProperty(String key) {return propertiesMap.get(key);}
}
区分应用,环境,集群的效果
分位数指标
- prometheus 四种 metrics 类型中,如果不是对性能特别敏感的场景,推荐使用 summary。详情阅读:
- summary 和 histogram 指标的简单理解 https://blog.csdn.net/wtan825/article/details/94616813
- prometheus 四种 metric 类型介绍 https://prometheus.wang/promql/prometheus-metrics-types.html
使用 summary 监控方法耗时
import com.google.common.base.Stopwatch;
import com.jellyfishmix.springbootexplore.server.config.PropertiesLoader;
import io.prometheus.client.CollectorRegistry;
import io.prometheus.client.Counter;
import io.prometheus.client.Summary;
import org.apache.commons.lang3.StringUtils;
import org.springframework.stereotype.Controller;
import org.springframework.web.bind.annotation.RequestMapping;
import org.springframework.web.bind.annotation.ResponseBody;import java.net.InetAddress;
import java.net.UnknownHostException;
import java.util.concurrent.ThreadLocalRandom;
import java.util.concurrent.TimeUnit;/*** @author jellyfishmix* @date 2024/1/3 23:18*/
@RequestMapping("/test")
@Controller
public class TestController {private static final CollectorRegistry DEFAULT_PROMETHEUS_REGISTRY = CollectorRegistry.defaultRegistry;private static final Summary DEMO_SUMMARY = Summary.build().name("TestController_compute_summary_demo").help("demo of summary").labelNames("labelName1", "labelNameB").quantile(0.5, 0.01).quantile(0.90, 0.01).quantile(0.99, 0.01).register(DEFAULT_PROMETHEUS_REGISTRY);@RequestMapping("/saySummary")@ResponseBodypublic String saySummary() {Stopwatch stopwatch = Stopwatch.createStarted();simulateInterfaceCall();var costMillis = stopwatch.elapsed().toMillis();DEMO_SUMMARY.labels("abc", "123").observe(costMillis);return "hello summary";}private static void simulateInterfaceCall() {// 模拟接口调用的随机耗时int randomDelay = ThreadLocalRandom.current().nextInt(100, 1000);try {TimeUnit.MILLISECONDS.sleep(randomDelay);} catch (InterruptedException e) {Thread.currentThread().interrupt();}}
}
quantile 方法
- 说明一下 Summary.build().quantile() 方法。
- .50 分位,误差 0.01,会把 [.49, .51] 范围内的指标计入 .50 分位,由于 summary 会在客户端把指标数记录下来,因此允许的误差越多,可以节约的内存占用越多。
- 其他分位以此类推。
# .50 分位,误差 0.01
.quantile(0.5, 0.01)
# .90 分位,误差 0.01
.quantile(0.90, 0.01)
# .99 分位,误差 0.01
.quantile(0.99, 0.01)
quantile 方法的详细说明可见 io.prometheus.client.Summary 的类注释,这里摘抄一段:
The Summary class provides different utility methods for observing values, like observe(double), startTimer() and Summary. Timer. observeDuration(), time(Callable), etc.
By default, Summary metrics provide the count and the sum. For example, if you measure latencies of a REST service, the count will tell you how often the REST service was called, and the sum will tell you the total aggregated response time. You can calculate the average response time using a Prometheus query dividing sum / count.
In addition to count and sum, you can configure a Summary to provide quantiles:Summary requestLatency = Summary. build().name("requests_latency_seconds").help("Request latency in seconds.").quantile(0.5, 0.01)    // 0.5 quantile (median) with 0.01 allowed error.quantile(0.95, 0.005)  // 0.95 quantile with 0.005 allowed error// ....register();As an example, a 0.95 quantile of 120ms tells you that 95% of the calls were faster than 120ms, and 5% of the calls were slower than 120ms.
Tracking exact quantiles require a large amount of memory, because all observations need to be stored in a sorted list. Therefore, we allow an error to significantly reduce memory usage.
In the example, the allowed error of 0.005 means that you will not get the exact 0.95 quantile, but anything between the 0.945 quantile and the 0.955 quantile.
Experiments show that the Summary typically needs to keep less than 100 samples to provide that precision, even if you have hundreds of millions of observations.
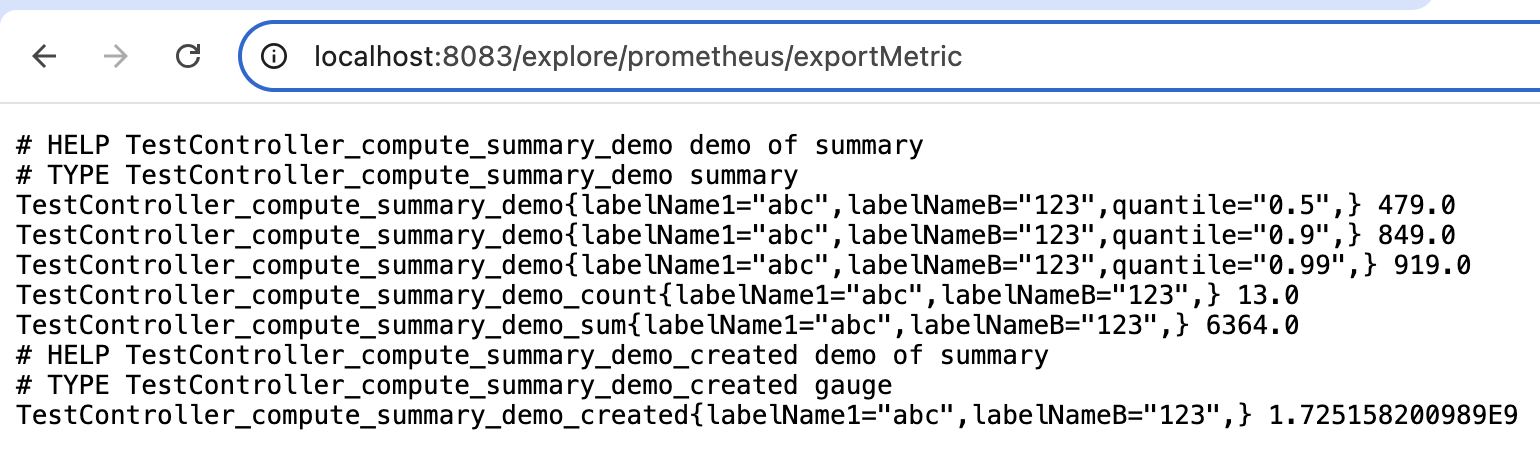
summary 分位数指标效果示例
grafana 视图
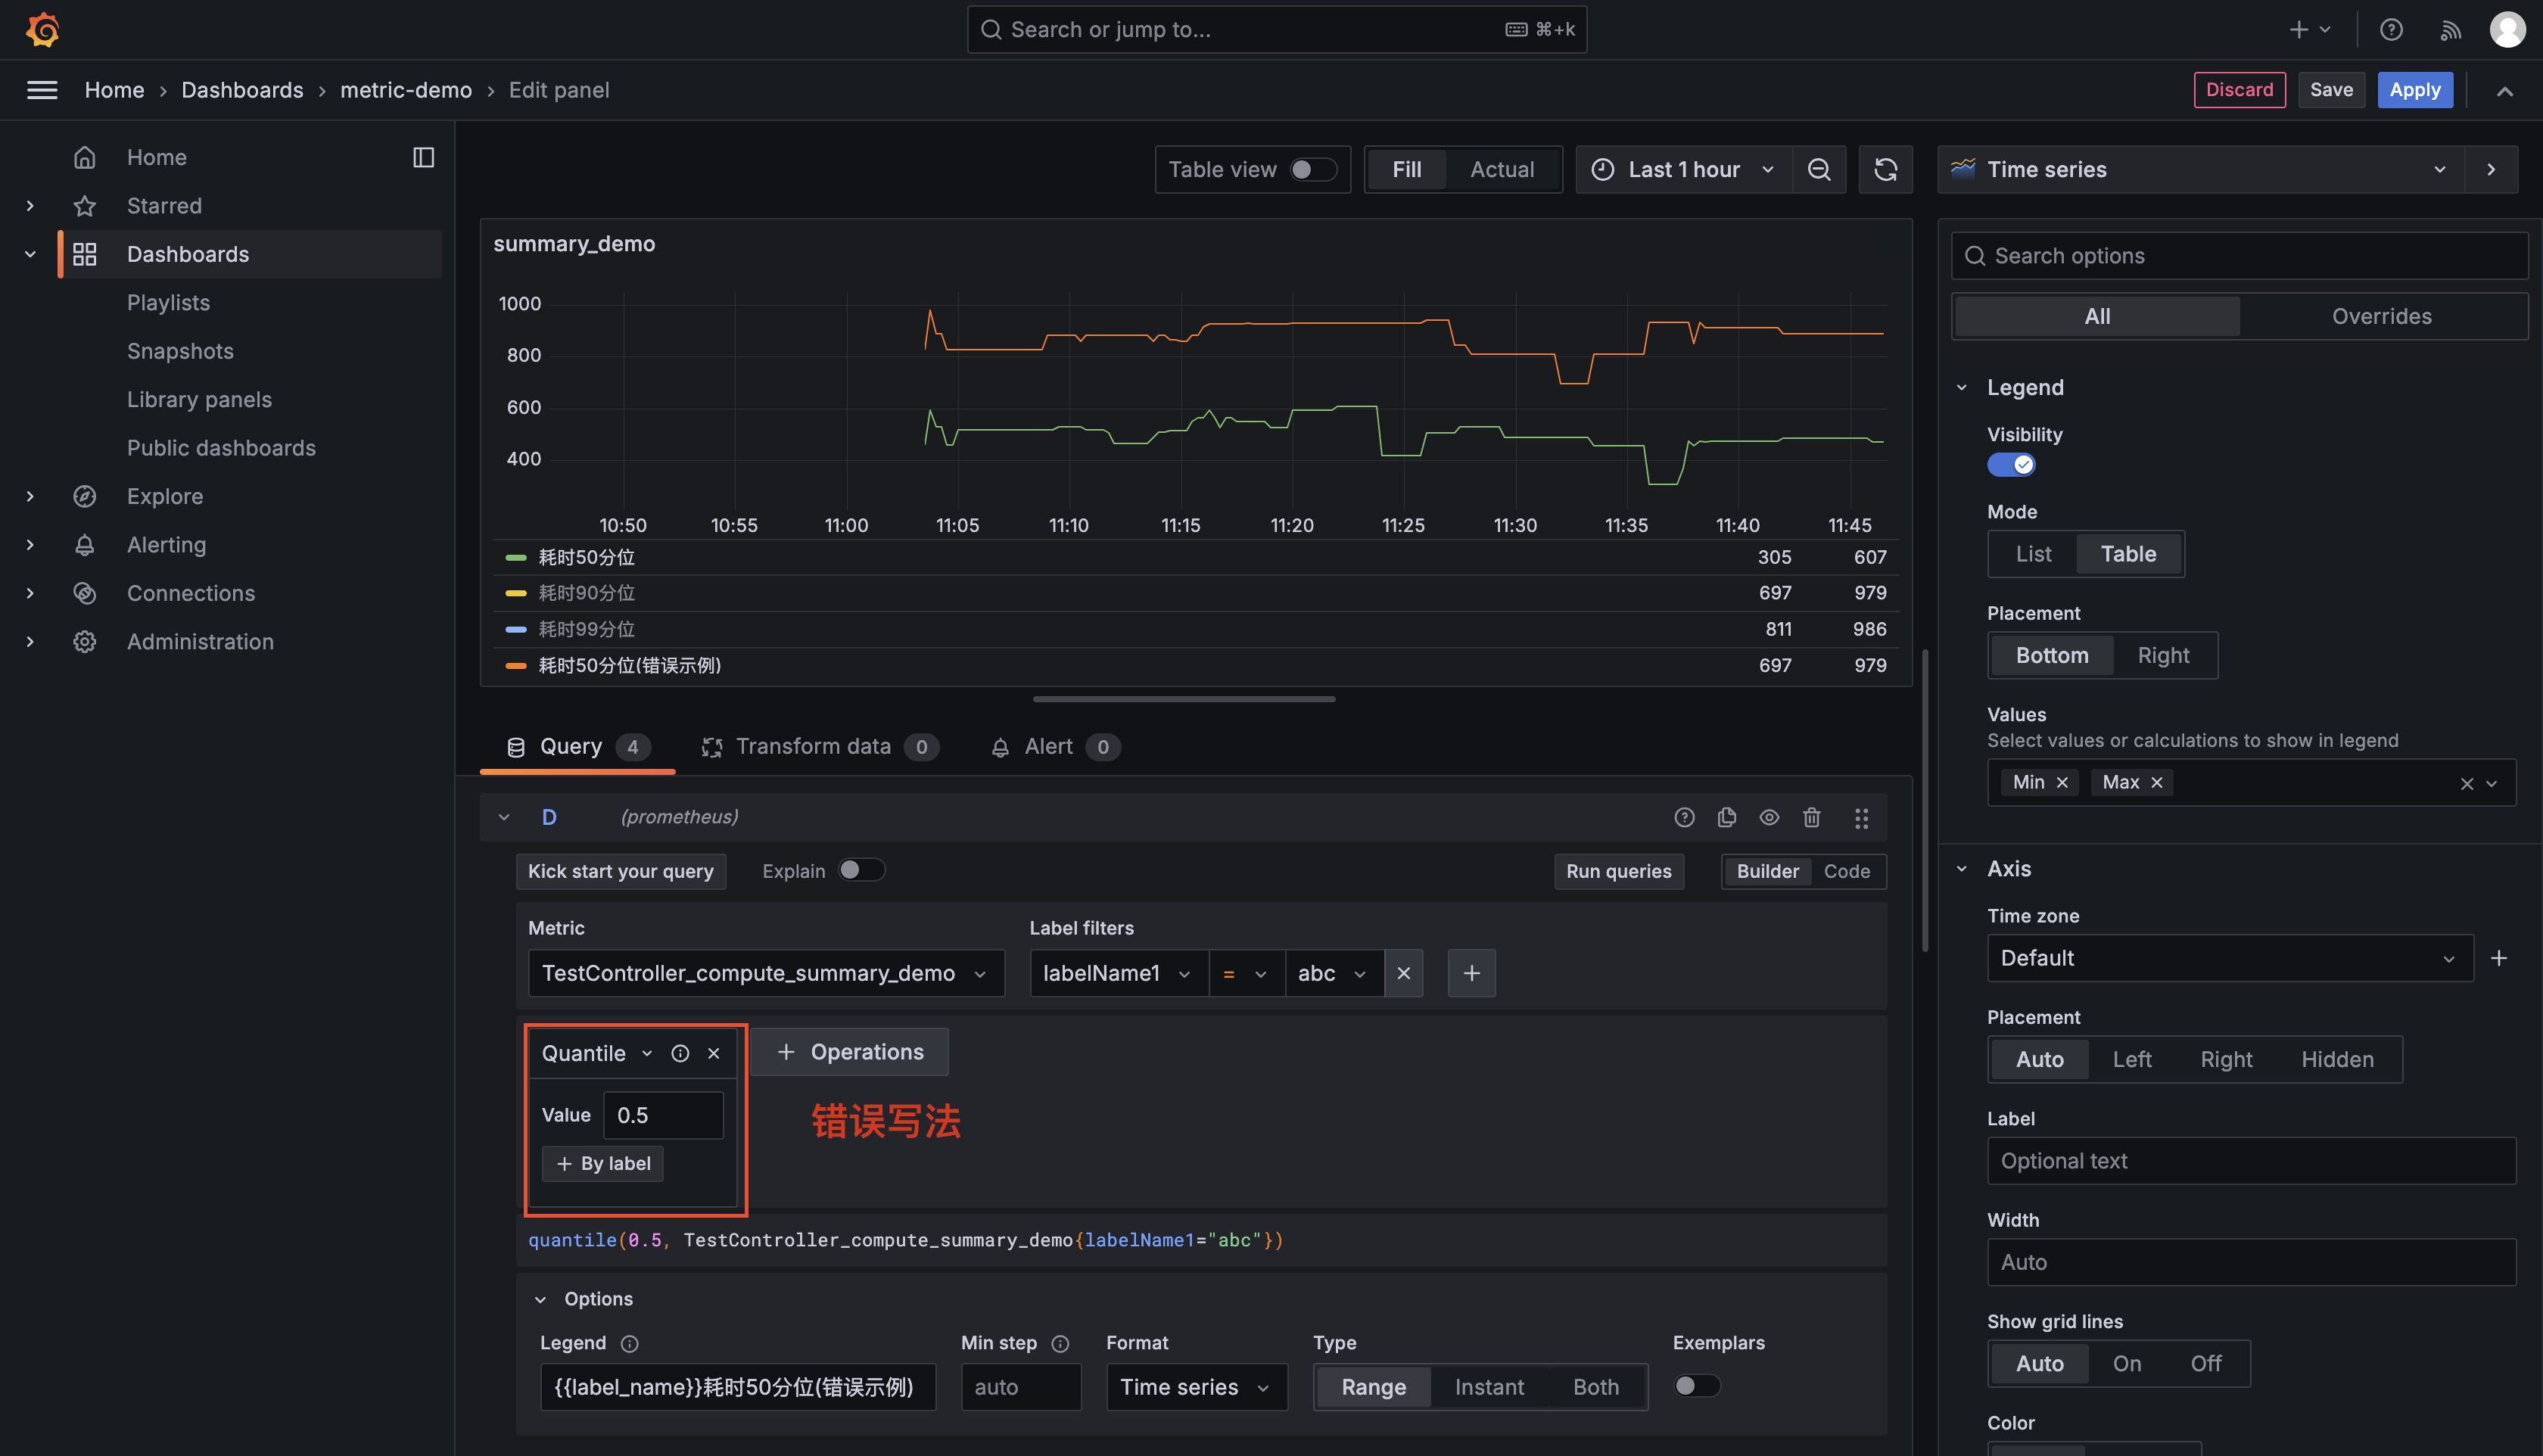
grafana query 填写示例如下,注意正确的分位数查询写法是如下图红圈所示,在 metric 位置填写 quantile = 0.5(客户端收集时填写的具体分位数)。
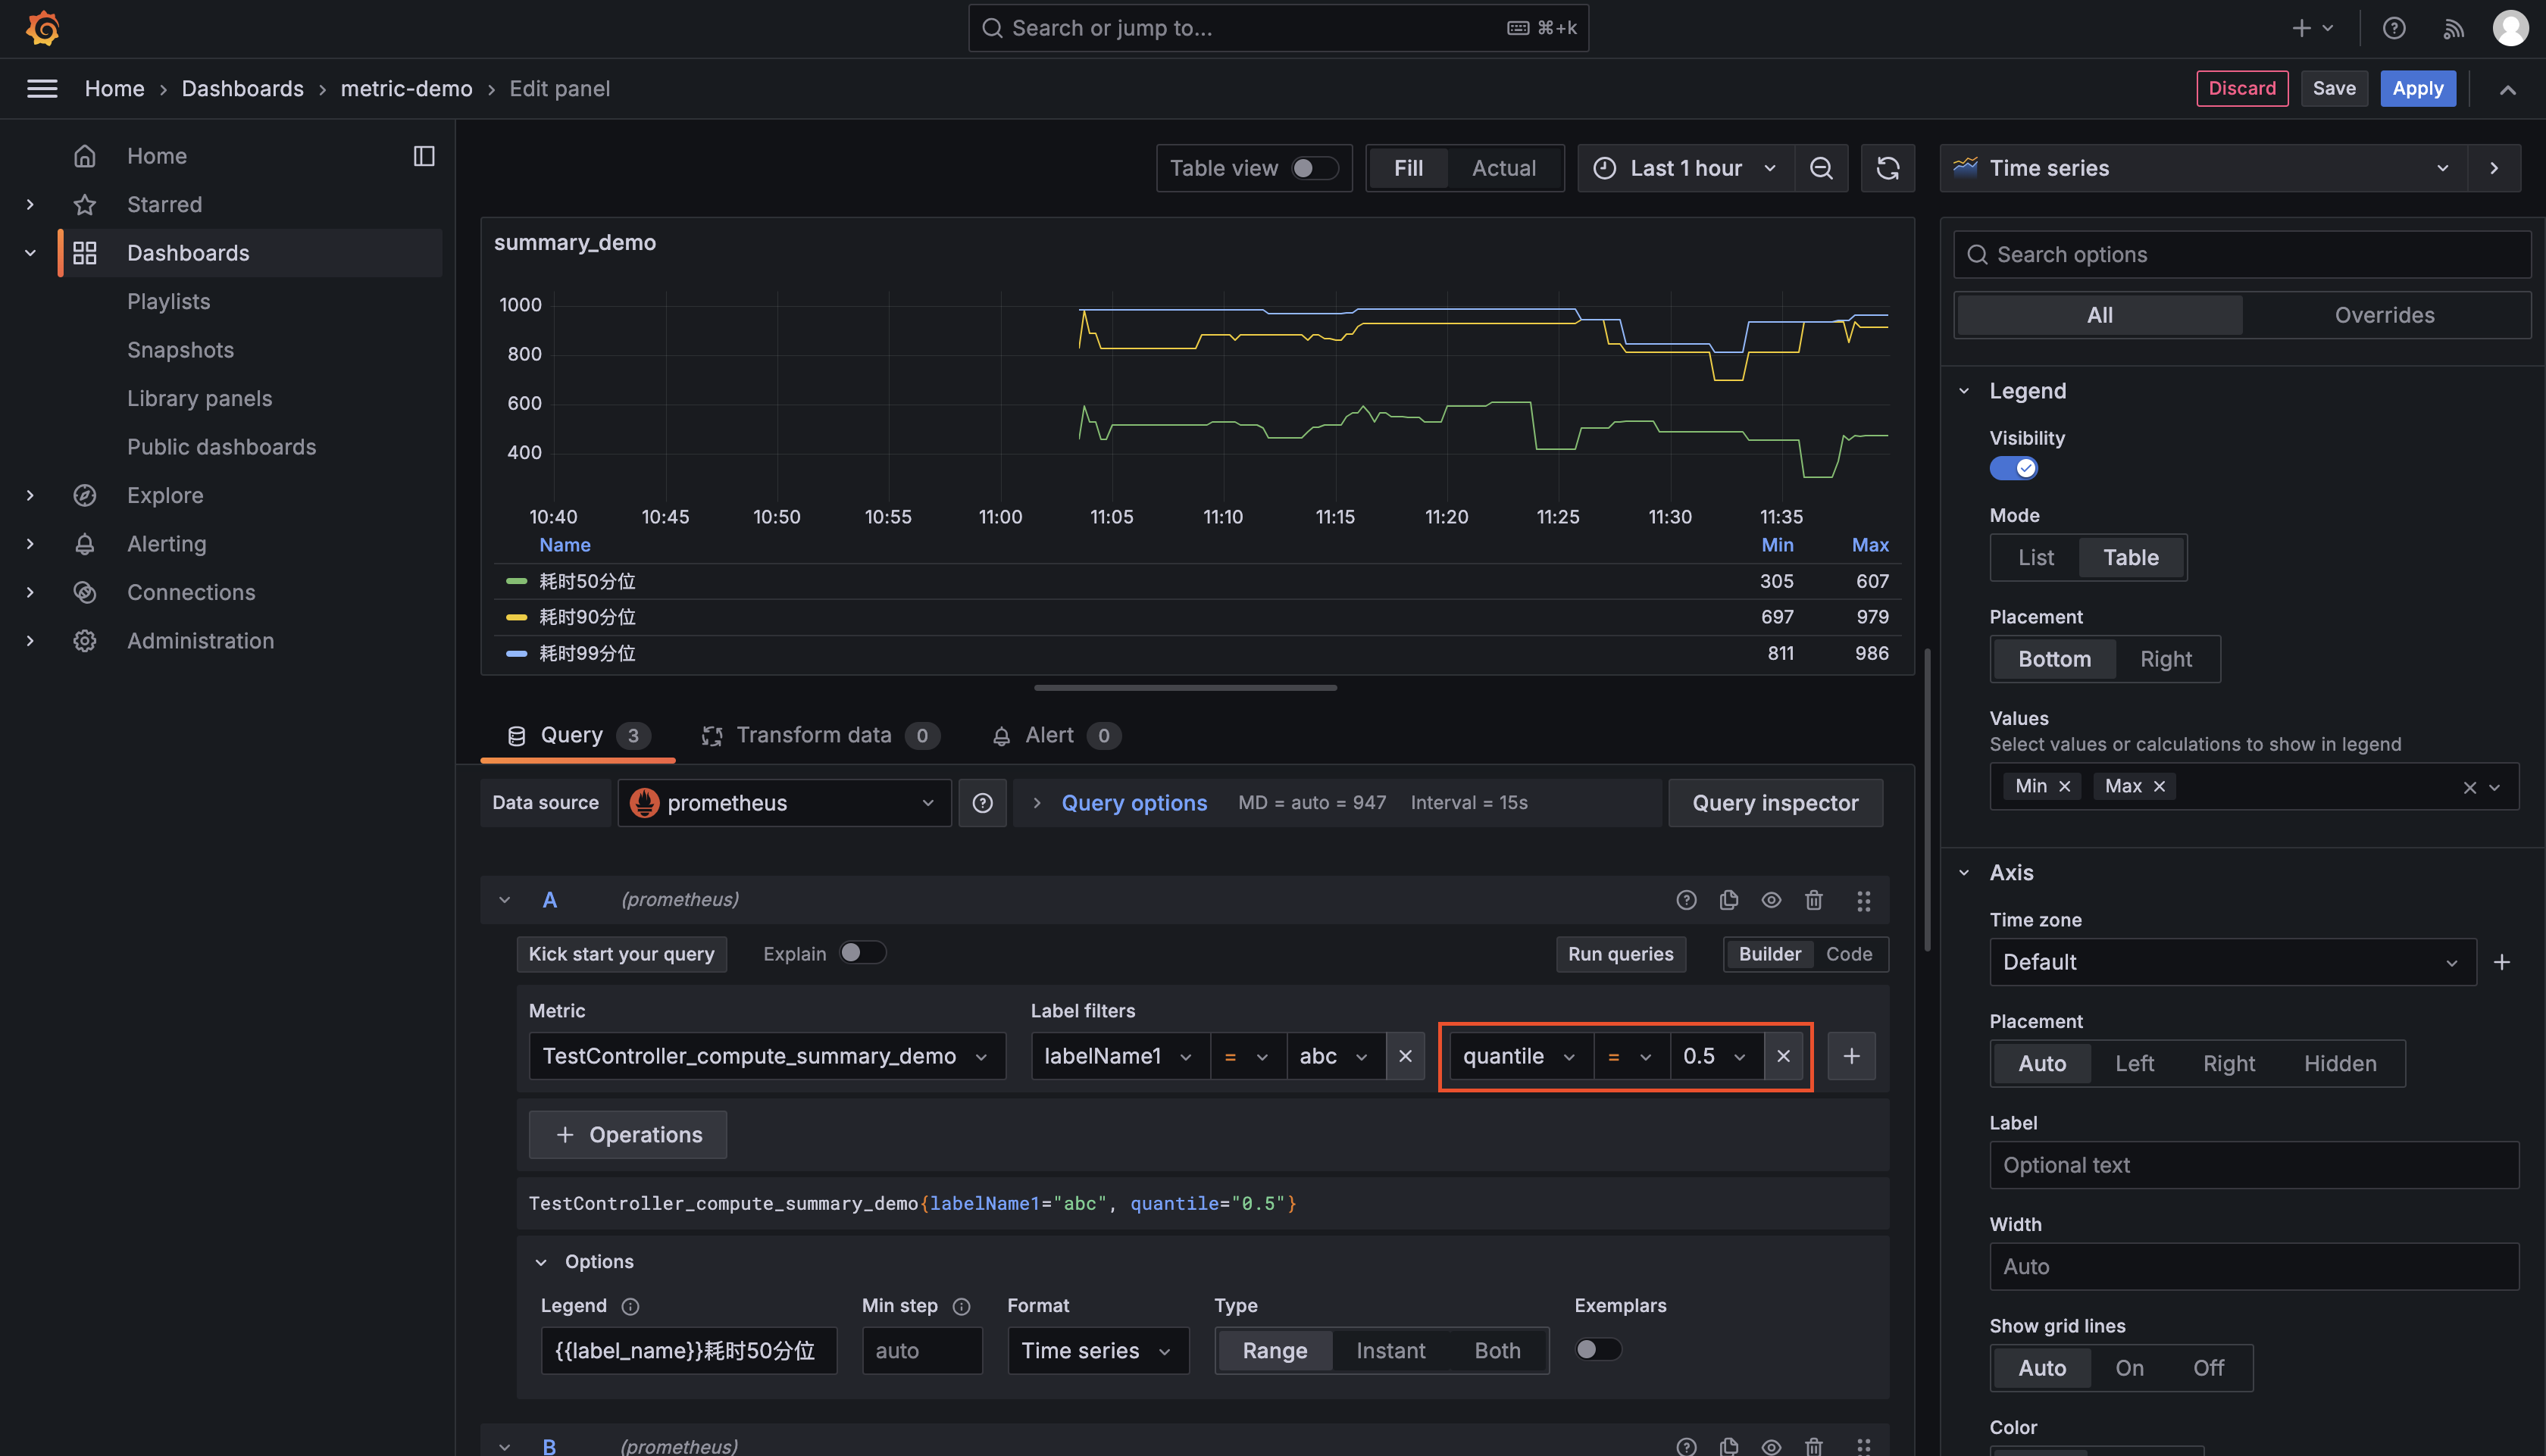
分位数查询错误示例: operations 中填写 quantile 是错误的写法,可以看到图中,通过 operations 计算出的和真实值差距很大。
这篇关于spring boot 项目 prometheus 自定义指标收集区分应用环境集群实例ip,使用 grafana 查询--方法耗时分位数指标的文章就介绍到这儿,希望我们推荐的文章对编程师们有所帮助!


