本文主要是介绍Prometheus+Grafana多方位监控,希望对大家解决编程问题提供一定的参考价值,需要的开发者们随着小编来一起学习吧!
Prometheus+Grafana多方位监控
契机
基础
docker安装
#grafana安装+挂载data
mkdir /x/grafana-storage
chmod 777  /x/grafana-storage
docker run -d \
-p 3000:3000 \
--name=grafana \
-v /x/grafana-storage:/var/lib/grafana \
grafana/grafana#promethes安装+挂载yml
mkdir /x/prometheus
#配置文件在下面
vim /x/prometheus/prometheus.yml
docker run  -d \
-p 9090:9090 \
--privileged=true \
--restart always \
--name=prometheus \
-v /x/prometheus/prometheus.yml:/etc/prometheus/prometheus.yml  \
prom/prometheus#进入grafana
http://localhost:3000
默认密码:admin admin
#修改ui和语言
#导入数据源prometheus
prometheus.yml最终配置
#全局配置
global:scrape_interval: 15sevaluation_interval: 15s#抓取配置
scrape_configs:#nginx监控- job_name: 'nginx'metrics_path: '/metrics' static_configs:- targets: ['localhost:9113']#es监控- job_name: "es"metrics_path: "/metrics"static_configs:- targets: [ "localhost:9111" ]#rabbitmq监控- job_name: "rabbitmq"metrics_path: "/metrics"static_configs:- targets: [ "localhost:15692" ]#ECS监控- job_name: nodestatic_configs:- targets: [ 'localhost:9091','localhost1:9091','localhost2:9091']#Java程序监控- job_name: servicemetrics_path: "/actuator/prometheus"static_configs:- targets: ["localhost:8090"]labels:application: applciation1- targets: ["localhost:9999"]labels:application: applciation2
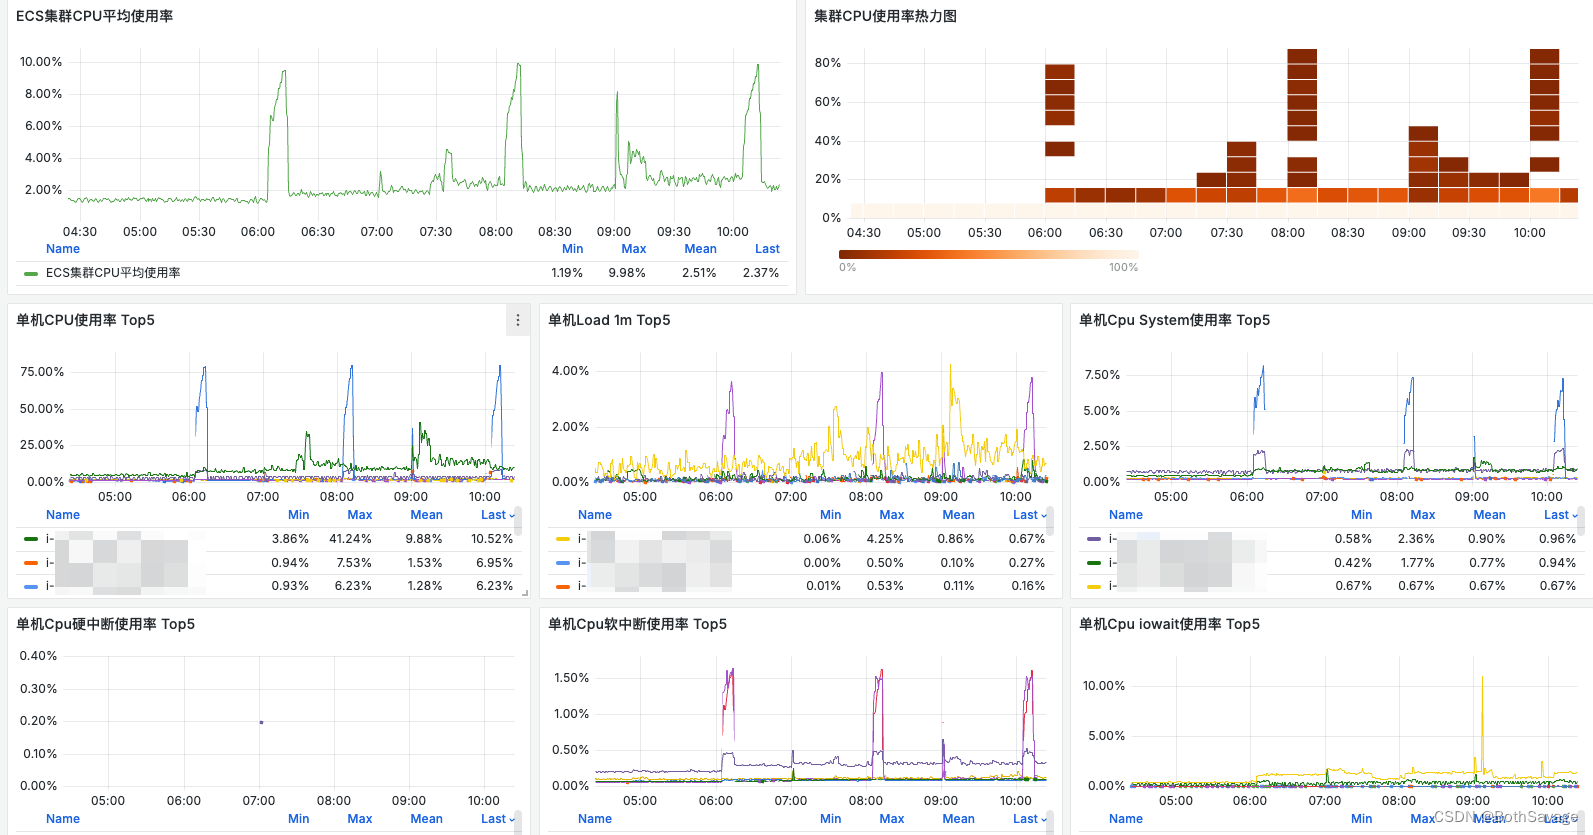
ECS监控
安装
如果选用的火山云的服务器直接参考,如果不是火山云需要参考文档安装
https://www.volcengine.com/docs/6731/1195154
https://www.volcengine.com/docs/6408/69457
#查看监控状态
systemctl status cloud-monitor-agent
#查看9091端口监听
ss -naltp | grep 9091
#返回如下信息时,表示监控组件工作正常,9091 端口已开启。
LISTEN     0      128       [::]:9091                  [::]:*                   users:(("cloud-monitor-a",pid=1661,fd=3))
#老火山服务器升级组件
sed -i 's/Prometheus: false/Prometheus: true/' /usr/local/cloud-monitor-agent/config.yaml && systemctl restart cloud-monitor-agent
#查看端口是否正常访问
curl 127.0.0.1:9091/metrics
监控配置
#抓取配置
scrape_configs:#ECS监控- job_name: nodestatic_configs:- targets: [ 'localhost:9091','localhost1:9091','localhost2:9091']
监控大盘
https://www.volcengine.com/docs/6731/1195154
拉到最下面就有一个监控大盘
效果演示
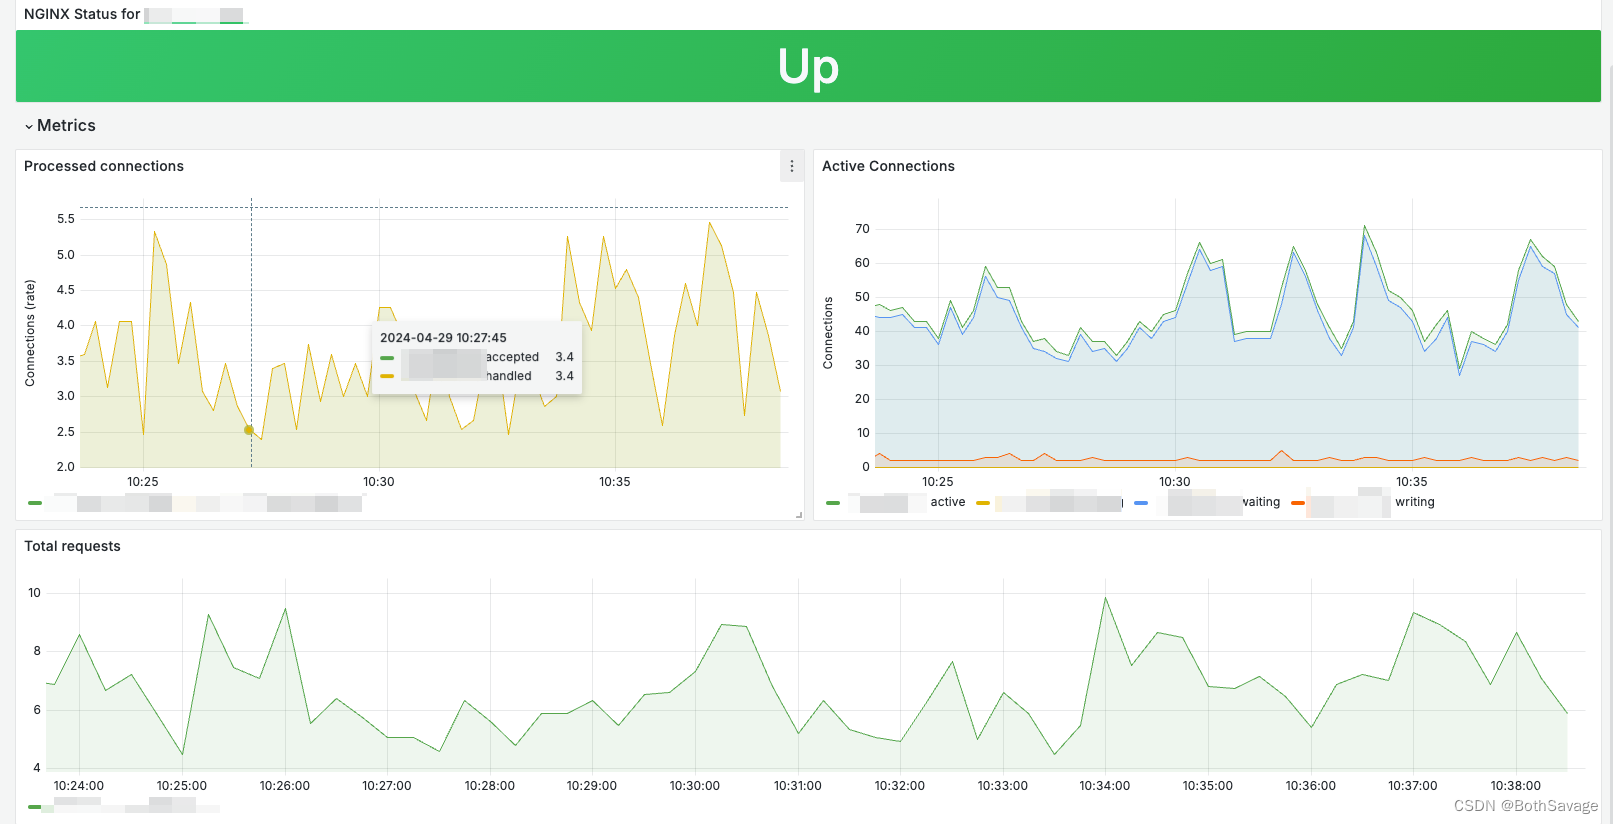
Nginx监控
安装
#查看nginx是否安装stub模块
nginx -V 2>&1 | grep -o with-http_stub_status_module#没安装的话需要参考其他教程安装#修改nginx.conf
server {listen 9088; listen [::]:9088; server_name localhost; location = /stub_status { stub_status;}
}#nginx配置刷新
nginx -t
nginx -s reload#校验
curl http://localhost:9088/stub_status#安装exporter
mkdir -p /home/prometheus_exporter/{nginx,es}
cd /home/prometheus_exporter/nginx
#这里要根据系统版本选择
wget https://github.com/nginxinc/nginx-prometheus-exporter/releases/download/v1.1.0/nginx-prometheus-exporter_1.1.0_linux_amd64.tar.gz
tar -xvf nginx-prometheus-exporter_1.1.0_linux_amd64.tar.gz
nohup /home/prometheus_exporter/nginx/nginx-prometheus-exporter -nginx.scrape-uri=http://localhost:9088/stub_status >> /dev/null 2>&1 &
监控配置
#抓取配置
scrape_configs:#nginx监控- job_name: 'nginx'metrics_path: '/metrics' static_configs:- targets: ['localhost:9113']
监控大盘
登陆grafana新建看板导入
https://grafana.com/grafana/dashboards/11199-nginx/
效果演示
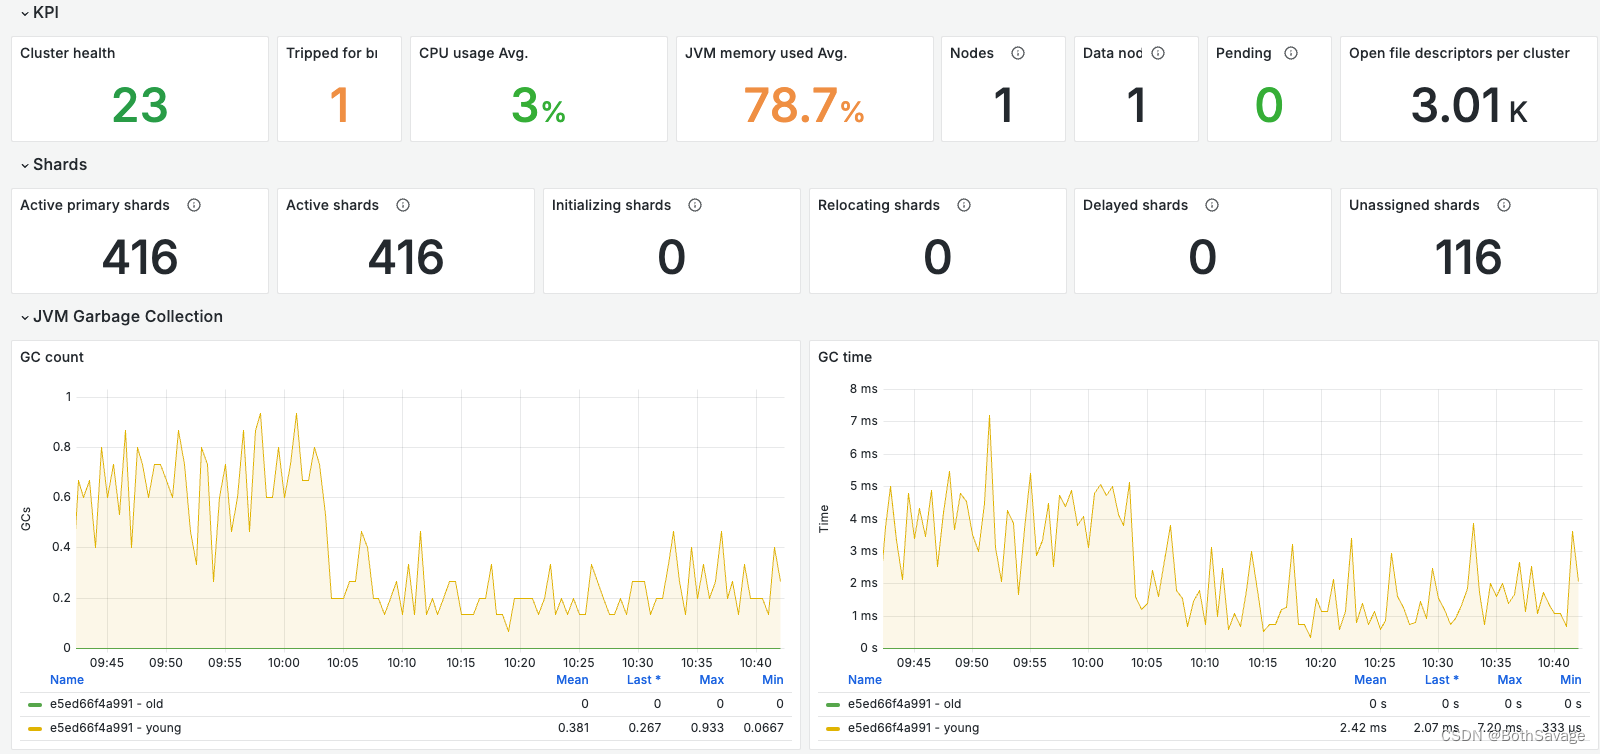
ElasticSearch监控
安装
#安装exporter
cd /home/prometheus_exporter/es
#这里要根据系统来选择
wget https://github.com/prometheus-community/elasticsearch_exporter/releases/download/v1.7.0/elasticsearch_exporter-1.7.0.linux-amd64.tar.gz
tar -xvf elasticsearch_exporter-1.7.0.linux-amd64.tar.gz
nohup /home/prometheus_exporter/es/elasticsearch_exporter-1.7.0.linux-amd64/elasticsearch_exporter  --web.listen-address :9111 --es.uri http://user:psw@localhost:9200 >> /dev/null 2>&1 &
监控配置
#抓取配置
scrape_configs:#es监控- job_name: "es"metrics_path: "/metrics"static_configs:- targets: [ "localhost:9111" ]
监控大盘
登陆grafana新建看板导入
https://grafana.com/grafana/dashboards/14191-elasticsearch-overview/
效果演示
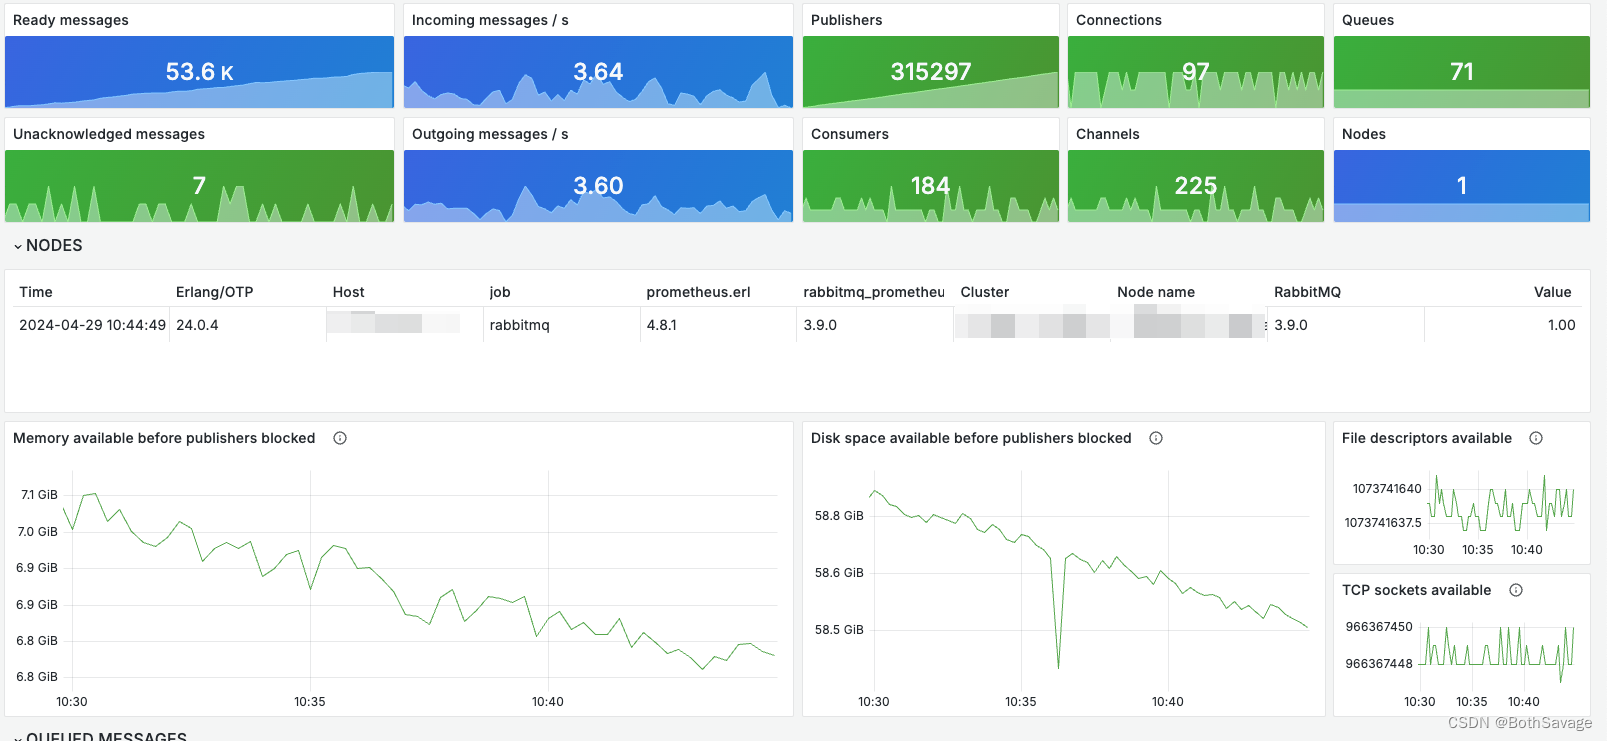
RabbitMQ监控
安装
#主要就会是暴露15692
docker run -d \
--privileged \
-p 5672:5672 -p 15672:15672 -p 15692:15692 \
--name rabbitmq \
--restart=always \
-v /home/docker/rabbitmq/data:/var/lib/rabbitmq \
rabbitmq:3.9.0-management#进入容器,启用插件
rabbitmq-plugins enable rabbitmq_prometheus
监控配置
#抓取配置
scrape_configs:#mq监控- job_name: "rabbitmq"metrics_path: "/metrics"static_configs:- targets: [ "localhost:15692" ]
监控大盘
登陆grafana新建看板导入
https://grafana.com/grafana/dashboards/10991-rabbitmq-overview/
效果演示
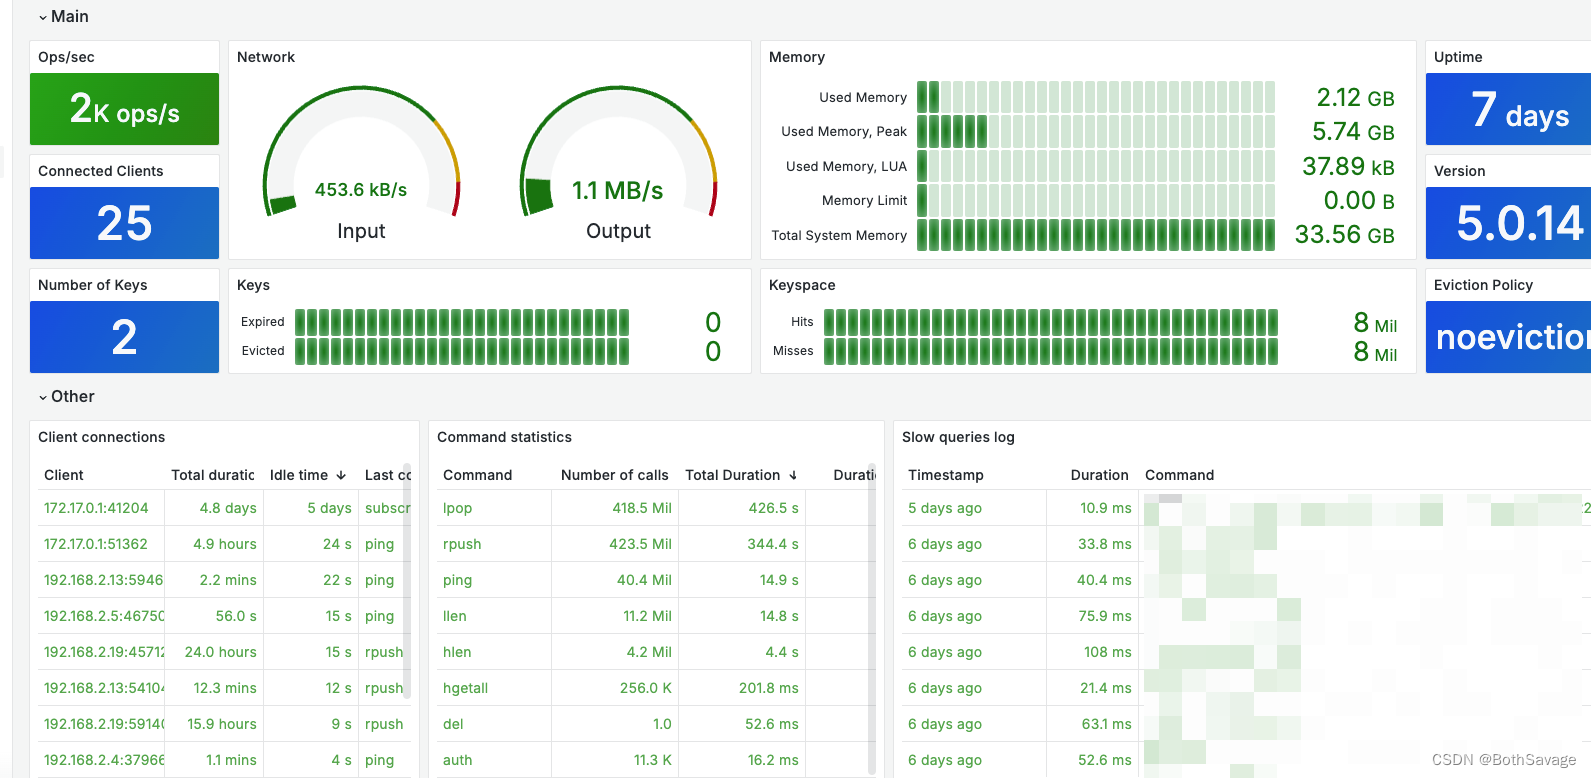
Redis监控
安装
#在grafana管理页面
#连接#数据源
#添加redis数据源即可
#无需监控配置
监控大盘
登陆grafana新建看板导入
https://grafana.com/grafana/dashboards/11835-redis-dashboard-for-prometheus-redis-exporter-helm-stable-redis-ha/
效果演示
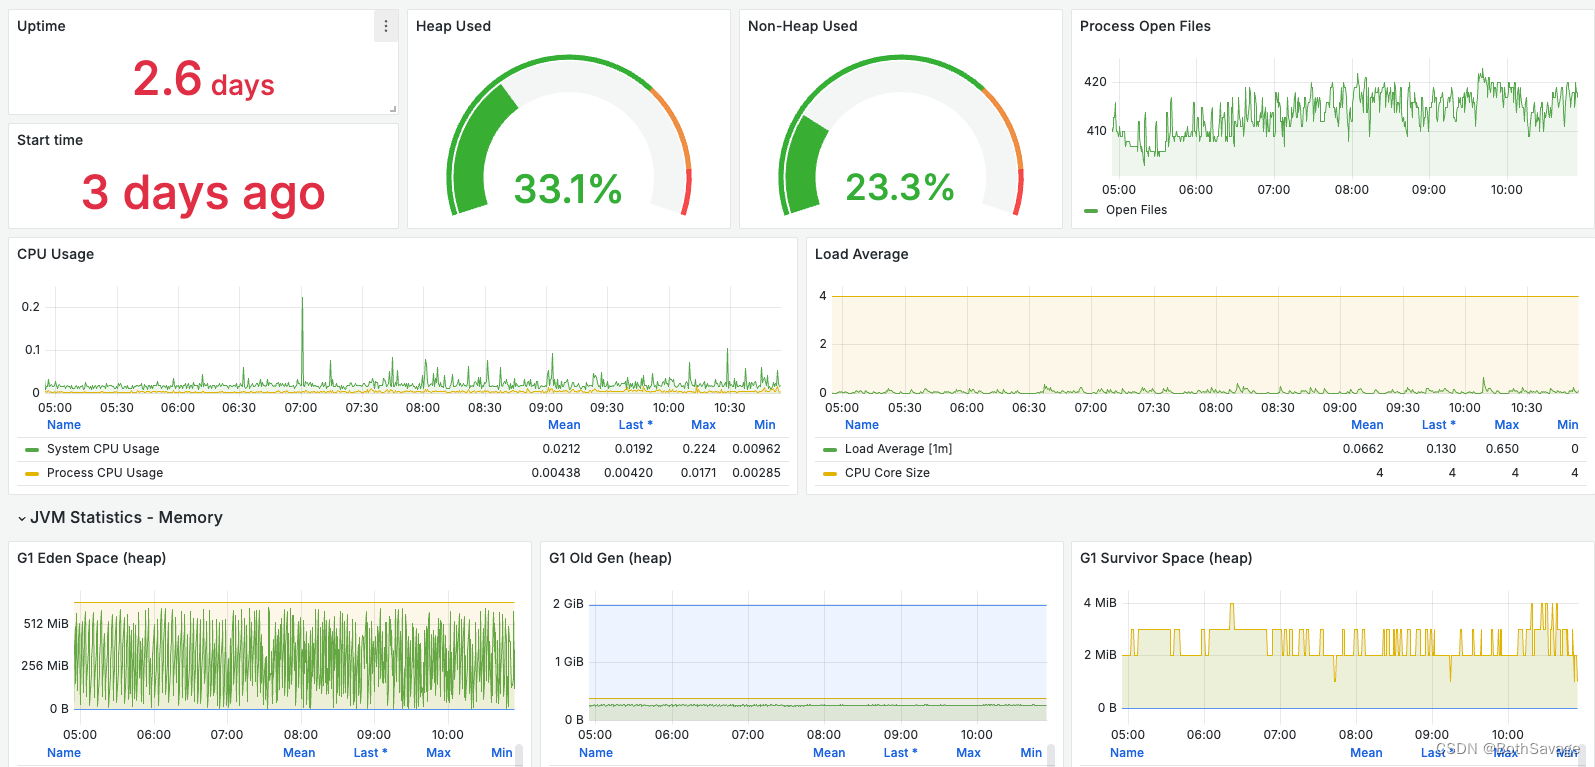
Java应用监控
安装
#pom导入
<dependency><groupId>io.micrometer</groupId><artifactId>micrometer-registry-prometheus</artifactId>
</dependency>#yml配置
management:endpoints:web:exposure:include: "*"endpoint:health:show-details: ALWAYS
监控配置
#抓取配置
scrape_configs:#Java程序监控- job_name: servicemetrics_path: "/actuator/prometheus"static_configs:- targets: ["localhost:8090"]labels:application: applciation1- targets: ["localhost:9999"]labels:application: applciation2
监控大盘
登陆grafana新建看板导入
https://grafana.com/grafana/dashboards/4701-jvm-micrometer/
https://grafana.com/grafana/dashboards/12900-springboot-apm-dashboard/
效果演示

写到最后
欢迎访问:https://bothsavage.github.io

这篇关于Prometheus+Grafana多方位监控的文章就介绍到这儿,希望我们推荐的文章对编程师们有所帮助!


