本文主要是介绍基本教程篇----第九节MasterSampleDemo.cs介绍,希望对大家解决编程问题提供一定的参考价值,需要的开发者们随着小编来一起学习吧!
第九节MasterSampleDemo.cs介绍
最近一直挺忙的,都没时间写博客了,好在这是基础篇的最后一篇了,我也可以歇歇了,关于其它的深入章节我会在以后的时间补上的。
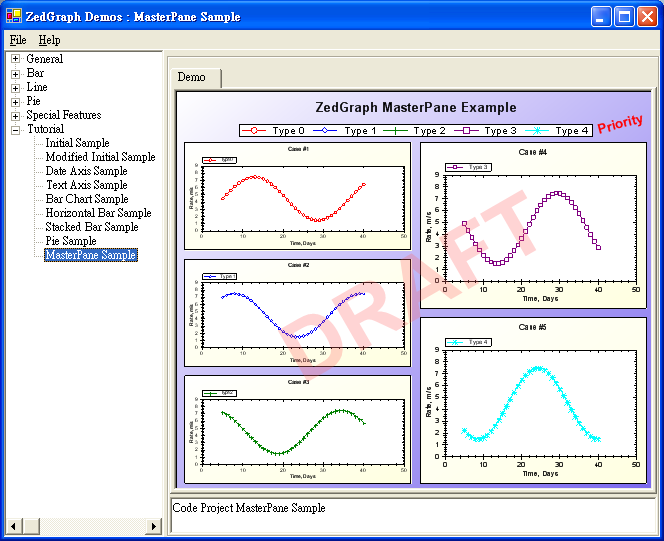
先来看看这一节的示图和源代码吧。
using System;
using System.Drawing;
using System.Collections;
using ZedGraph;
namespace ZedGraph.Demo
{
/// <summary>
/// Summary description for SimpleDemo.
/// </summary>
public class MasterSampleDemo : DemoBase
{
public MasterSampleDemo() : base( "Code Project MasterPane Sample",
"MasterPane Sample", DemoType.Tutorial )
{
MasterPane myMaster = base.MasterPane;
// Remove the default GraphPane that comes with ZedGraphControl
myMaster.PaneList.Clear();
// Set the masterpane title
myMaster.Title = "ZedGraph MasterPane Example";
myMaster.IsShowTitle = true;
// Fill the masterpane background with a color gradient
myMaster.PaneFill = new Fill( Color.White, Color.MediumSlateBlue, 45.0F );
// Set the margins to 10 points
myMaster.MarginAll = 10;
// Enable the masterpane legend
myMaster.Legend.IsVisible = true;
myMaster.Legend.Position = LegendPos.TopCenter;
// Add a priority stamp
TextItem text = new TextItem( "Priority", 0.88F, 0.12F );
text.Location.CoordinateFrame = CoordType.PaneFraction;
text.FontSpec.Angle = 15.0F;
text.FontSpec.FontColor = Color.Red;
text.FontSpec.IsBold = true;
text.FontSpec.Size = 15;
text.FontSpec.Border.IsVisible = false;
text.FontSpec.Border.Color = Color.Red;
text.FontSpec.Fill.IsVisible = false;
text.Location.AlignH = AlignH.Left;
text.Location.AlignV = AlignV.Bottom;
myMaster.GraphItemList.Add( text );
// Add a draf watermark è
text = new TextItem( "DRAFT", 0.5F, 0.5F );
text.Location.CoordinateFrame = CoordType.PaneFraction;
text.FontSpec.Angle = 30.0F;
text.FontSpec.FontColor = Color.FromArgb( 70, 255, 100, 100 );
text.FontSpec.IsBold = true;
text.FontSpec.Size = 100;
text.FontSpec.Border.IsVisible = false;
text.FontSpec.Fill.IsVisible = false;
text.Location.AlignH = AlignH.Center;
text.Location.AlignV = AlignV.Center;
text.ZOrder = ZOrder.A_InFront;
myMaster.GraphItemList.Add( text );
// Initialize a color and symbol type rotator
ColorSymbolRotator rotator = new ColorSymbolRotator();
// Create some new GraphPanes
for ( int j=0; j<5; j++ )
{
// Create a new graph - rect dimensions do not matter here, since it
// will be resized by MasterPane.AutoPaneLayout()
GraphPane myPane = new GraphPane( new Rectangle( 10, 10, 10, 10 ),
"Case #" + (j+1).ToString(),
"Time, Days",
"Rate, m/s" );
// Fill the GraphPane background with a color gradient
myPane.PaneFill = new Fill( Color.White, Color.LightYellow, 45.0F );
myPane.BaseDimension = 6.0F;
// Make up some data arrays based on the Sine function
PointPairList list = new PointPairLis_u40 ?);
for ( int i=0; i<36; i++ )
{
double x = (double) i + 5;
double y = 3.0 * ( 1.5 + Math.Sin( (double) i * 0.2 + (double) j ) );
list.Add( x, y );
}
// Add a curve to the Graph, use the next sequential color and symbol
LineItem myCurve = myPane.AddCurve( "Type " + j.ToString(),
list, ro_u97 ?tor.NextColor, rotator.NextSymbol );
// Fill the symbols with white to make them opaque
myCurve.Symbol.Fill = new Fill( Color.White );
// Add the GraphPane to the MasterPane
myMaster.Add( myPane );
}
Graphics g = this.ZedGraphControl.CreateGraphics();
// Tell ZedGraph to auto layout the new GraphPanes
myMaster.AutoPaneLayout( g, PaneLayout.ExplicitRow32 );
myMaster.AxisChange( g );
g.Dispose();
}
}
}
这一节主要是讲多 pane 的创建方法。里面大部分的方法和属性在以前的章节中已经介绍过了,这里只想讲三个地方: MasterPane 类、 ColorSymbolRotator 类和 ZOrder 这个属性的用法。
首先就是 MasterPane 类。这个类就是创建多 pane 的类,是一个 GraphPane 类的集合。它里面的大部分属性和方法都继承自 PaneBase 和 Object 。像 .NET 一样,这个类提供了 Item 和 PaneList 属性来设置和获取里面的成员。在程序中我们也看到了,其实 MasterPane 什么也没做,就是把其它的类一项项的 Add 进它的集合中。
ColorSymbolRotator 类就是一个为 GraphPane.AddCurve 方法循环提供不同颜色和符号的类。这个类的东西不多,我个人认为就相当于一个枚举一样,我们可以看到程序中只用到了 rotator.NextColor rotator.NextSymbol 这两个属性,来获取不同的颜色和符号。
最后就是 Zorder 这个属性了,在前面的几节中我们也见过这个属性,可是当时我没有讲,现在我说说。 Zorder 就是图形在 Z 轴的位置。如果我们在平面上把左右看成 X 轴,把上下看成 Y 轴,那么内外就是 Z 轴了,也就是 Zorder 就是图形在内外的位置 ( 这个内外是针对其它图形来说的 ) 。我们可以看看示图中的 DRAFT 这个水印的效果,这就是 Zorder 的功能。如果你把程序中的
text.ZOrder = ZOrder.A_InFront; 改成 text.ZOrder = ZOrder.G_BehindAll;
那么 DRAFT 就是如下的效果了, DRAFT 就在各个 Pane 的下面了。
Zorder 是一个枚举共有七个枚举值。分别是 G_BehindAll 、 F_BehindAxisFill 、 E_BehindAxis 、 D_BehindCurves 、 C_BehindAxisBorder 、 B_BehindLegend 和 A_InFront 。具体的解释如
| Member Name | Description | ||
| G_BehindAll | Specifies that the GraphItem will be behind all other objects (including the PaneBase Title). | ||
| F_BehindAxisFill | Specifies that the GraphItem will be behind the AxisRect background Fill (see AxisFill). | ||
| E_BehindAxis | Specifies that the GraphItem will be behind the Axis objects. | ||
| D_BehindCurves | Specifies that the GraphItem will be behind the CurveItem objects. | ||
| C_BehindAxisBorder | Specifies that the GraphItem will be behind the Axis border. | ||
| B_BehindLegend | Specifies that the GraphItem will be behind the Legend object. | ||
| A_InFront | Specifies that the GraphItem will be in front of all other objects, except for the other GraphItem objects that have the same ZOrder and are before this object in the GraphItemList. | ||
| Member Name | Description | | |
| G_BehindAll | Specifies that the GraphItem will be behind all other objects (including the PaneBase Title). | | |
| F_BehindAxisFill | Specifies that the GraphItem will be behind the AxisRect background Fill (see AxisFill). | | |
| E_BehindAxis | Specifies that the GraphItem will be behind the Axis objects. | | |
| D_BehindCurves | Specifies that the GraphItem will be behind the CurveItem objects. | | |
| C_BehindAxisBorder | Specifies that the GraphItem will be behind the Axis border. | | |
| B_BehindLegend | Specifies that the GraphItem will be behind the Legend object. | | |
| A_InFront | Specifies that the GraphItem will be in front of all other objects, except for the other GraphItem objects that have the same ZOrder and are before this object in the GraphItemList. | | |
| | | | |
这篇关于基本教程篇----第九节MasterSampleDemo.cs介绍的文章就介绍到这儿,希望我们推荐的文章对编程师们有所帮助!


