本文主要是介绍vue3+eachrts饼图轮流切换显示高亮数据,希望对大家解决编程问题提供一定的参考价值,需要的开发者们随着小编来一起学习吧!
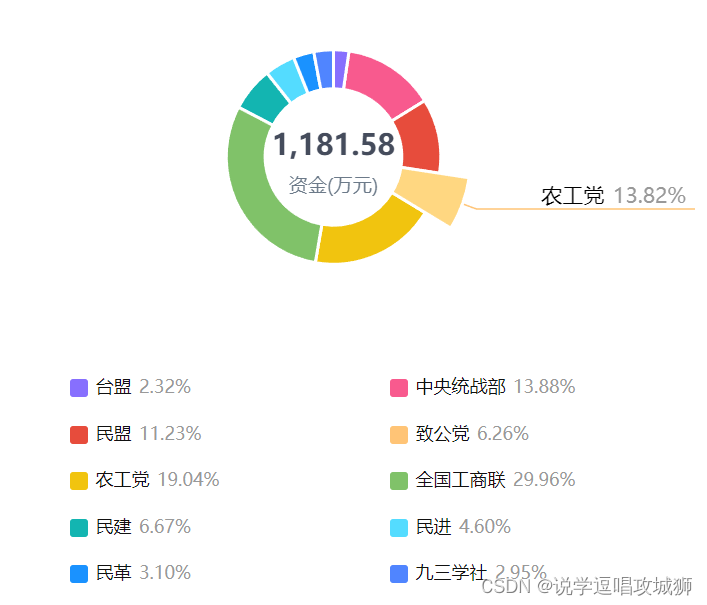
<template><div class="charts-box"><div class="charts-instance" ref="chartRef"></div>// 自定义legend 样式<div class="charts-note"><span v-for="(items, index) in data.dataList" class="charts-legend"><span class="legend" :style="{background:colorList[index]}"></span><span>{{items.name}}</span><span style="color: #999999;margin-left: 5px;">{{((items.value / props.total)*100).toFixed(2) }}%</span></span></div></div></template><script setup>import {ref, onMounted, onUnmounted, reactive, watch} from 'vue'import * as echarts from 'echarts'import useEmitter from "@/hooks/useEmitter";import {findRightBottomPie, removeTrailingZeros} from "@/views/BangFuData/service"; // 接口const props = defineProps(['timeRange', 'dictItem', 'total'])const emitter = useEmitter()const chartRef = ref()const data = reactive({dataList: [{"name": "中央统战部","value": "4742.93","count": null,"type": null},{"name": "民盟","value": "439.47","count": null,"type": null},{"name": "致公党","value": "377.23","count": null,"type": null},{"name": "农工党","value": "1181.58","count": null,"type": null},{"name": "民建","value": "365.38","count": null,"type": null},{"name": "民进","value": "200.72","count": null,"type": null},{"name": "全国工商联","value": "2112.68","count": null,"type": null},{"name": "民革","value": "102.70","count": null,"type": null},{"name": "九三学社","value": "439.30","count": null,"type": null},{"name": "台盟","value": "24.50","count": null,"type": null}],})const colorList =['#876FFE', '#F85A8E','#E74C3C','#FFC476','#F1C40F','#80C269','#13B5B1','#54DCFF','#1A92FF','#5085FF', '#F85A8E','#E74C3C','#FFC476','#F1C40F','#80C269','#13B5B1']const findData = (callback) => {let rightBottomPieRes = findRightBottomPie(props.timeRange === 'previous' ? 2 : 1)rightBottomPieRes.then(res => {// let arr = []// props.dictItem.find(qhItem => {//   let result = res.find(item => item.name.indexOf(qhItem.label) > -1)//   if (result) {//     arr.push({name: qhItem.label, value: result.value})//   } else {//     arr.push({name: qhItem.label, value: 0})//   }// })data.dataList = rescallback()})}let myChart = nullconst option = ref(null)const buildOption = () => {let _option = {tooltip: {show: false,trigger: 'item',},legend: {show: false,itemWidth: 12,itemHeight: 12,itemGap: 20,icon: 'roundRect',bottom: '5%',left: '45px',right: '45px',formatter: (name) => {let total = 0;let tarValue = 0;for (let i = 0; i < data.dataList.length; i++) {total += parseFloat(data.dataList[i].value);}for (let index = 0; index < data.dataList.length; index++) {if (name.indexOf(data.dataList[index].name)> -1) {if(total && total !== 0){tarValue = ((data.dataList[index].value / total)*100).toFixed(2);}}}// if(tarValue === 0){//   return `{oneone|${name}}`;// }return `{oneone|${name}}   {threethree|${removeTrailingZeros(tarValue)}%}`;},textStyle: {rich: {threethree: {color: "#999",}}}},title: {text: '0',//主标题文本subtext:'资金(万元)',//副标题文本right:'center',top:'42%',textStyle:{fontSize: '1.2rem',color:'#454c5c',align:'center'},subtextStyle:{fontFamily : "微软雅黑",fontSize: '0.8rem',color:'#6c7a89',}},color: colorList,series: [{name: '',type: 'pie',radius: ['35%', '55%'],center: ['50%', '50%'],avoidLabelOverlap: false,itemStyle: {borderRadius: 0,borderColor: '#fff',borderWidth: 2},// label: {//     show: false,//     position: 'center'// },emphasis: {label: {show: true,fontSize: 20,fontWeight: 'bold'},scale: true,scaleSize: 20},// labelLine: {//     show: false// },label: {show: true,alignTo: 'edge',formatter: '{name|{b}} {time|{d}%} \n',minMargin: 5,edgeDistance: 10,lineHeight: 15,rich: {name: {fontSize: 14,color: '#000'},time: {fontSize: 14,color: '#999'}}},labelLine: {show: true,length: 30,length2: 0,maxSurfaceAngle: 80},labelLayout: function (params) {const isLeft = params.labelRect.x < myChart.getWidth() / 2;const points = params.labelLinePoints;// Update the end point.points[2][0] = isLeft  ? params.labelRect.x : params.labelRect.x + params.labelRect.width;return {labelLinePoints: points};},data: data.dataList}]}_option.series[0].data = data.dataList;option.value = _option}const handleChartLoop = (option, myChart) => {if (!myChart) {return;}let currentIndex = -1; // 当前高亮图形在饼图数据中的下标let timeTicket = setInterval(selectPie, 2000); // 设置自动切换高亮图形的定时器// 取消所有高亮并高亮当前图形function highlightPie() {// 遍历饼图数据,取消所有图形的高亮效果for (let idx in option.series[0].data) {myChart.dispatchAction({type: "downplay",seriesIndex: 0,dataIndex: idx,});}// 高亮当前图形myChart.dispatchAction({type: "highlight",seriesIndex: 0,dataIndex: currentIndex,});let data = option.series[0].data[currentIndex] && option.series[0].data[currentIndex].value ? option.series[0].data[currentIndex].value : 0myChart.setOption({title: {text: removeTrailingZeros(parseFloat(data).toFixed(2))},series: {label: {show: false,formatter: () => {if ((option.series[0].data[currentIndex] && option.series[0].data[currentIndex].value === 0)|| !props.total || props.total == 0) {return `{name|${option.series[0].data[currentIndex].name}} {time|0%} \n`}let val = removeTrailingZeros(((option.series[0].data[currentIndex].value/props.total)*100).toFixed(2))return `{name|${option.series[0].data[currentIndex].name}} {time|${val}%} \n`}}}})}// 用户鼠标悬浮到某一图形时,停止自动切换并高亮鼠标悬浮的图形myChart.on("mouseover", (params) => {clearInterval(timeTicket);currentIndex = params.dataIndex;highlightPie();});// 用户鼠标移出时,重新开始自动切换myChart.on("mouseout", (params) => {if (timeTicket) {clearInterval(timeTicket);}timeTicket = setInterval(selectPie, 1000);});// 高亮效果切换到下一个图形function selectPie() {let dataLen = option.series[0].data.length;currentIndex = (currentIndex + 1) % dataLen;highlightPie();}}watch(() => props.timeRange, (nv, ov) => {findData(()=>buildOption())})watch(()=>option.value,(newOption,oldOption)=>{if(myChart == null) {myChart = echarts.init(chartRef.value);}option.value && myChart && myChart.setOption(newOption)if(oldOption==null){option.value && myChart && handleChartLoop(option.value,myChart);} else {//option.value && myChart && handleChartLoop(option.value,myChart);}})onMounted(()=>{myChart = echarts.init(chartRef.value);findData(()=>buildOption());emitter.on('echartsTimeRangeChange',()=>setTimeout(() => myChart && myChart.resize({width:chartRef.value.clientWidth,height:chartRef.value.clientHeight}), 50))emitter.on('echartsUpdate',()=>myChart && myChart.resize({width:chartRef.value.clientWidth,height:chartRef.value.clientHeight}))})onUnmounted(()=>{emitter.off('echartsTimeRangeChange')emitter.off('echartsUpdate')myChart.dispose()})</script><style scoped>.charts-box{height: calc(100% - 48px);}.charts-instance{height: 60%;width: 100%;overflow: hidden;
}
.charts-note{margin-left: 15%;height: 40%;overflow: hidden;
}
.charts-legend {display: inline-block;vertical-align: middle;margin-top: 15px;width: 50%;font-size: 12px;
}
.legend {display: inline-block;vertical-align: middle;margin-right:5px;width: 12px;height: 12px;border-radius: 2px;
}</style>
这篇关于vue3+eachrts饼图轮流切换显示高亮数据的文章就介绍到这儿,希望我们推荐的文章对编程师们有所帮助!


