本文主要是介绍建立没有数据集96准确性的辣胡椒分类器,希望对大家解决编程问题提供一定的参考价值,需要的开发者们随着小编来一起学习吧!
数据科学 , 机器学习 (Data Science, Machine Learning)
In this article, I will create an AI capable of recognizing a spicy pepper from measurements and color. Because you won’t be able to find any dataset on the measurements of spicy peppers online, I will generate it myself using statistics methodologies. In a second article, I may try to apply regression algorithms to estimate the spiciness of your pepper on the Scoville Scale.
在本文中,我将创建一个能够通过测量和颜色识别辣辣椒的AI。 因为您将无法在线上找到任何关于辣辣椒测量的数据集,所以我将使用统计方法自行生成该数据集。 在第二篇文章中,我可能会尝试使用回归算法以Scoville量表估算您的胡椒的辛辣度。
处理: (Process:)
- Finding Available Data 查找可用数据
- Making Measurements 进行测量
- Creating the dataset from distributions 从分布创建数据集
- Creating the Model 创建模型
- Performance Evaluation 绩效评估
1.查找可用数据 (1. Finding available data)
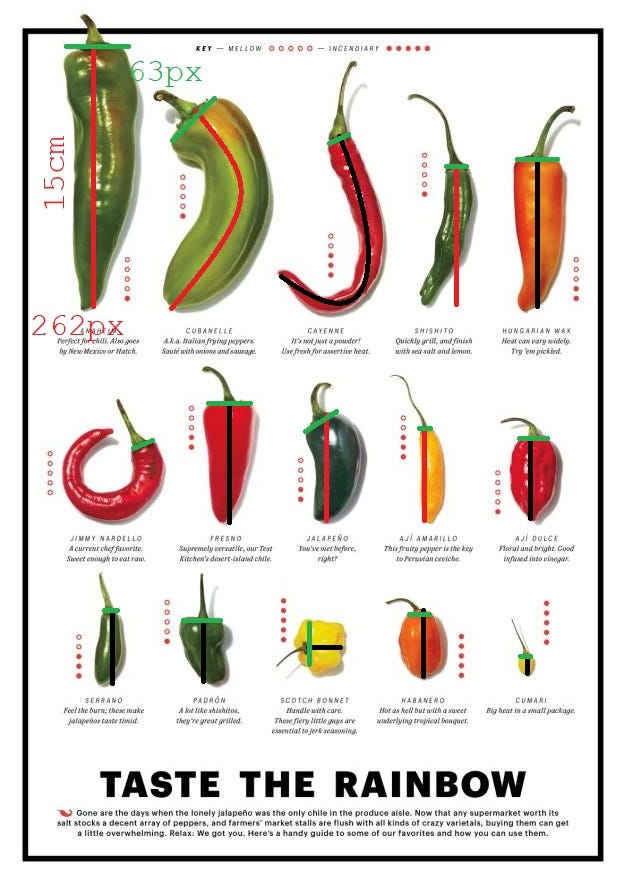
As mentioned before, you will unlikely find a dataset for everything you wish to build. In my case, I wanted to build a spicy pepper classifier, which is a difficult task if you have no data to start with. The only thing I could find on the internet was a comparison table of different spicy peppers (hopefully on the same scale).
如前所述,您不太可能找到要构建的所有内容的数据集。 就我而言,我想构建一个辣味分类器,如果没有任何数据开始,这将是一项艰巨的任务。 我在互联网上唯一能找到的是一张不同麻辣胡椒的比较表(希望是相同的比例)。

I will need to transform this data into a digital one. What I can do is take measurements of these images and place them as features in a dataset.
我将需要将此数据转换为数字数据。 我所能做的就是对这些图像进行测量,并将它们作为特征放置在数据集中。
2.进行测量 (2. Making Measurements)
To make measurements I can use pixels. After knowing the rate of conversion of pixels to centimeters I can measure the size of each spicy pepper in pixels and convert it to its real-world scale.
为了进行测量,我可以使用像素。 在了解了像素到厘米的转换率之后,我可以测量每个香辛椒的大小(以像素为单位),并将其转换为现实世界的比例。
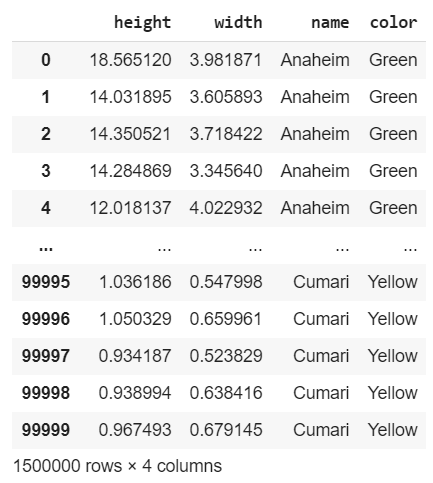
This is the final table with all measurements (name, height, width, and color) converted into features.
这是最终表,其中所有度量(名称,高度,宽度和颜色)均已转换为特征。
#   measurements
pepper_measurements_px = [
                          ['Anaheim', 262, 63, 'Green'],
                          ['Cubanelle', 222, 70, 'Green'],
                          ['Cayenne', 249, 22, 'Red'],
                          ['Shishito', 140, 21, 'Green'],
                          ['Hungarian Wax', 148, 63, 'Orange'],
['Jimmy Nardello', 190, 23, 'Red'],
                          ['Fresno', 120, 43, 'Red'],
                          ['Jalapeno', 106, 40, 'Dark Green'],
                          ['Aji Amarillo', 92, 13, 'Yellow'],
                          ['Aji Dulce', 81, 30, 'Red'],
['Serrano', 74, 14, 'Dark Green'],
                          ['Padron', 62, 38, 'Dark Green'],
                          ['Scotch Bonnet', 37, 42, 'Yellow'],
                          ['Habanero', 67, 21, 'Orange'],
                          ['Cumari', 18, 11, 'Yellow'],
]
I will now generate a dataset of 100.000 samples for spicy peppers.
现在,我将生成一个100.000个辛辣辣椒样本的数据集。
3.从分布创建数据集 (3. Creating datasets from distributions)
Before starting to create distributions, I will first need to convert the pixels into centimeters. Then for both length and width, I will need two separate normal distributions using this data as mean. For a standard deviation, I will use 10% of the mean (in this way I won’t have to Google the details of every spicy pepper).
在开始创建分布之前,我首先需要将像素转换为厘米。 然后,对于长度和宽度,我将需要使用此数据作为均值的两个单独的正态分布。 对于标准差,我将使用平均值的10%(这样,我就不必在Google上搜索每个辛辣胡椒的详细信息)。
创建功能 (Creating Functions)
I am creating a set of functions that will allow the creation of n datasets, inputting the size. I will use 100,000 samples for spicy pepper.
我正在创建一组函数,将允许创建n个数据集,并输入大小。 我将用100,000个样本制作辣胡椒。
#simulated probability distribution of one stock
from scipy.stats import skewnorm
import matplotlib.pyplot as plt
import pandas as pd
import numpy as npdef create_peppers(sd, mean, alfa, size):
  #invertire il segno di alfa
  x = skewnorm.rvs(-alfa, size=size)
  def calc(k, sd, mean):
    return (k*sd)+mean
  x = calc(x, sd, mean) #standard distribution#graph the distribution
  #pd.DataFrame(x).hist(bins=100)#pick one random number from the distribution
  #formally I would use cdf, but I just have to pick randomly from the 1000000 samples
  df = [np.random.choice(x) for k in range(size)]
  #return the DataFrame
  return pd.DataFrame(df)def cm_converter(px_measurements):
  pc_cm = 0.05725
  for _ in range(len(px_measurements)):
    px_measurements[_][1] *= pc_cm
    px_measurements[_][2] *= pc_cm
  return px_measurements
创建数据集 (Creating the Dataset)
I am now ready to create the datasets. I can specify the use of the 10% of the mean as a standard deviation (I can easily change it from height_sd and widht_sd):
我现在准备创建数据集。 我可以指定使用平均值的10%作为标准偏差(我可以很容易地从height_sd和widht_sd进行更改):
#   create converted list
pepper_measurements_cm = cm_converter(pepper_measurements_px)#   create final datasets
heigh_sd = 0.1
width_sd = 0.1df = pd.DataFrame()
for _ in pepper_measurements_cm:
  #   create height
  #SD is 10% of the height
  df_height = create_peppers(_[1]*heigh_sd, _[1], 0, 100000)
  #   create width
  #SD is 10% of the width
  df_width = create_peppers(_[2]*width_sd, _[2], 0, 100000)
  #create DataFrame
  df_single = pd.concat([df_height, df_width], axis=1)
  df_single.columns = ['height', 'width']
  #create name
  df_single['name'] = str(_[0])
  df_single['color'] = str(_[3])df = pd.concat([df, df_single], axis=0)
df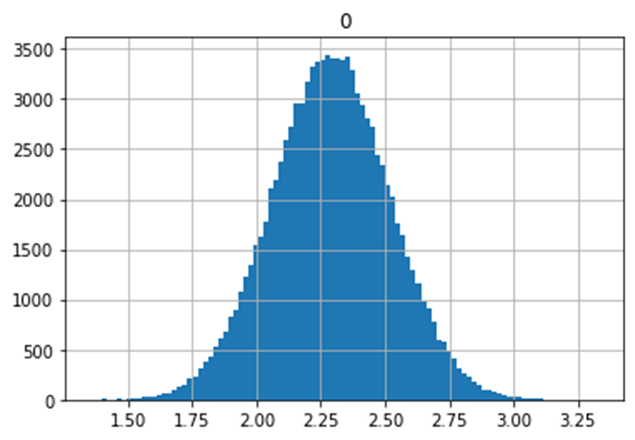
This is the final result: combined, the dataset counts 1.5 Million samples:
这是最终结果:合并后,数据集计数了150万个样本:
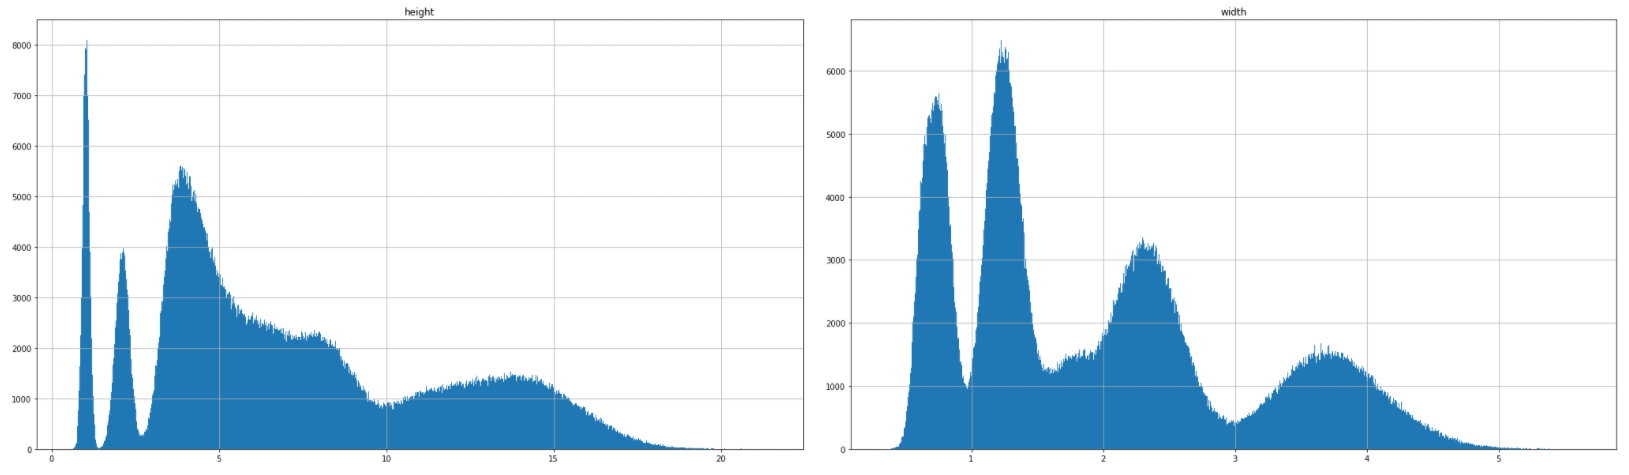
If we plot height and width in different histograms:
如果我们在不同的直方图中绘制高度和宽度:
4.创建模型 (4. Creating the Model)
The model I will be using is a Naive Bayes Classifier. Rather than many other models, this one is specialized with data that:
我将使用的模型是朴素贝叶斯分类器。 而不是许多其他模型,该模型专用于以下数据:
- Is independent 是独立的
- Follows a normal distribution 服从正态分布
Because I built my dataset following these presuppositions, this classifier is perfect for what I wish to build.
因为我是按照这些前提建立数据集的,所以该分类器非常适合我要构建的内容。
前处理 (Preprocessing)
The only preprocessing step I will have to make is encoding the color with a one_hot encoding algorithm:
我唯一要做的预处理步骤是使用one_hot编码算法对颜色进行编码:
#backup
X = df.copy()def one_hot(df, partitions):
  #togliamo le colonne da X
  for col in partitions:
    k = df.pop(col)
    k = pd.get_dummies(k, prefix=col)
    df = pd.concat([df, k] , axis=1)
  return dfX = one_hot(X, ['color'])
X
选择功能和标签 (Selecting Features and Labels)
y = X.pop('name')
y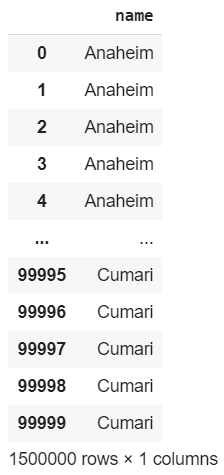
X
分裂 (Splitting)
from sklearn.model_selection import train_test_splitX_train, X_test, y_train, y_test = train_test_split(X, y, test_size=0.2, random_state=42)I will now split Features and Labels randomly, a ratio of 80:20 will suffice.
现在,我将随机分割特征和标签,比率为80:20就足够了。
训练模型 (Training the Model)
from sklearn.naive_bayes import GaussianNB
clf = GaussianNB()
clf.fit(X_train, y_train)
The model has been trained:
该模型已经过训练:
GaussianNB(priors=None, var_smoothing=1e-09)5.绩效评估 (5. Performance Evaluation)
After training the model, I will test it on the part of the dataset which the AI has never seen during training:
训练完模型后,我将在AI在训练过程中从未见过的数据集部分进行测试:
clf.score(X_test, y_test, sample_weight=None)
0.9659133333333333
The model has reached an outstanding 96% accuracy!
该模型达到了出色的96%精度!
翻译自: https://medium.com/towards-artificial-intelligence/building-a-spicy-pepper-classifier-with-no-datasets-96-accuracy-8262d54a8117
相关文章:
这篇关于建立没有数据集96准确性的辣胡椒分类器的文章就介绍到这儿,希望我们推荐的文章对编程师们有所帮助!


