本文主要是介绍【保姆级教程】YOLOv8_Pose多目标+关键点检测:训练自己的数据集,希望对大家解决编程问题提供一定的参考价值,需要的开发者们随着小编来一起学习吧!
Yolov8官方给出的是单类别的人体姿态关键点检测,本文将记录如果实现训练自己的多类别的关键点检测。
一、YOLOV8环境准备
1.1 下载安装最新的YOLOv8代码
仓库地址: https://github.com/ultralytics/ultralytics
1.2 配置环境
pip install -r requirements.txt -i https://pypi.tuna.tsinghua.edu.cn/simple
二、数据准备
2.1 安装labelme标注软件
pip install labelme
2.1.2 打开roLabelImg软件
使用Anaconda Prompt启动labeme标注工具

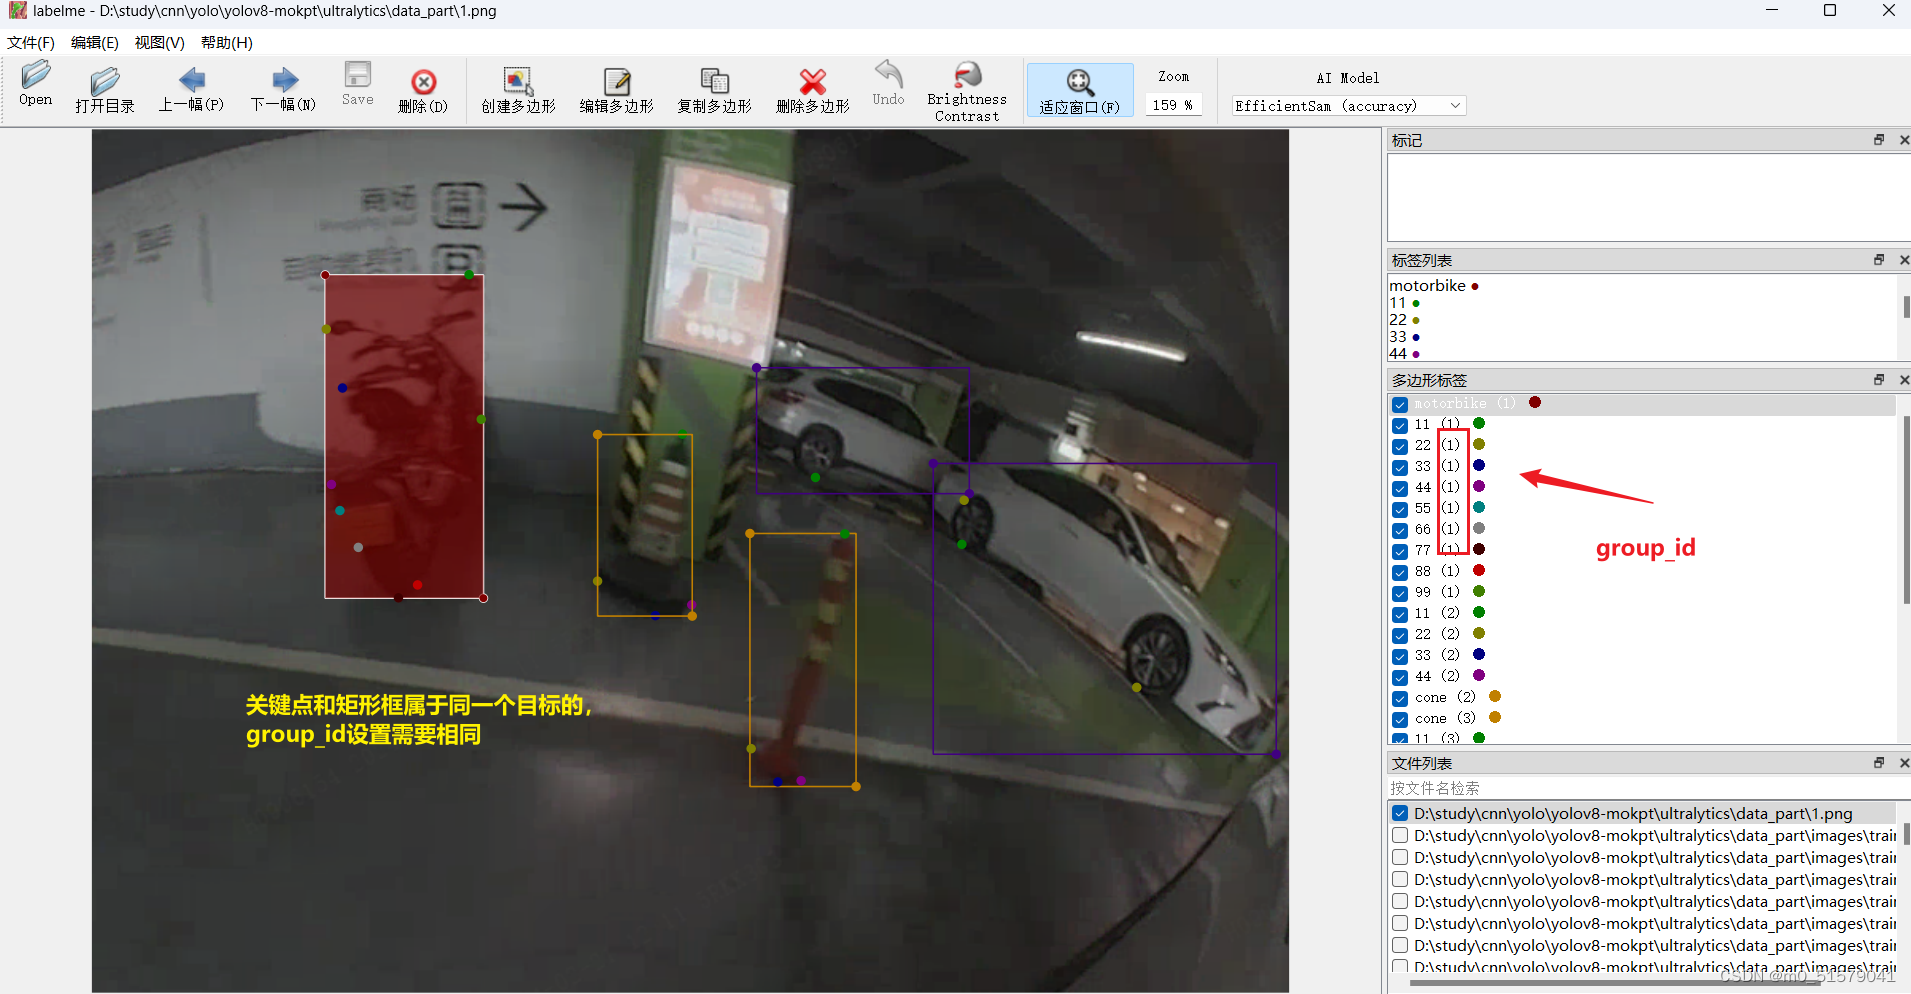
2.2 标注自己的数据
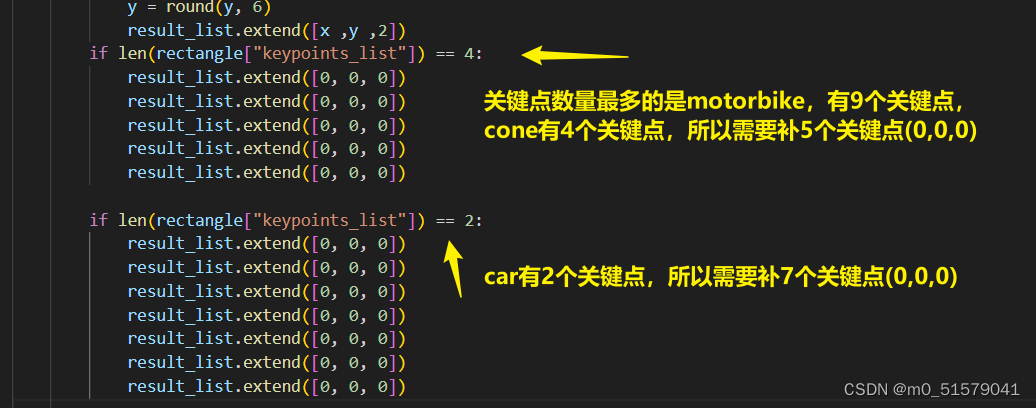
不同的目标的关键点可以自己定义,关键点数量少的目标,再下一步转换标签格式的时候,需要将关键点的数量补齐。例如,下图所示的摩托车有9个关键点,汽车有2个关键点,那边汽车的标签还需要补上7个 0 0 0 (坐标为0,且不可见)。这样才能进行多目标的关键点检测的训练。
我这里的关键点命名按 11 , 22, 33, … ,99来命名的,读者可以根据自己的实际情况来命名。
2.3 数据转换
2.3.1 运行下面代码,将xml标签格式转为txt标签格式
关键点数量对齐
# 将labelme标注的json文件转为yolo格式
import os
import cv2
import numpy as np
import matplotlib.pyplot as plt
import glob
import json
import tqdm
# 物体类别class_list = ["motorbike","car","cone"]
# 关键点的顺序
keypoint_list = ["11", "22", "33", "44","55", "66", "77", "88", "99"]
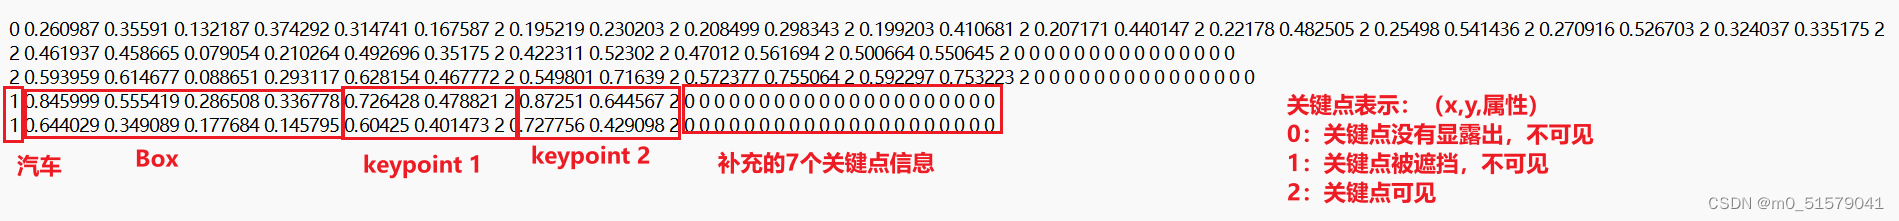
def json_to_yolo(img_data ,json_data):h ,w = img_data.shape[:2]# 步骤:# 1. 找出所有的矩形,记录下矩形的坐标,以及对应group_id# 2. 遍历所有的head和tail,记下点的坐标,以及对应group_id,加入到对应的矩形中# 3. 转为yolo格式rectangles = {}# 遍历初始化for shape in json_data["shapes"]:label = shape["label"] # pen, head, tailgroup_id = shape["group_id"] # 0, 1, 2, ...points = shape["points"] # x,y coordinatesshape_type = shape["shape_type"]# 只处理矩形,读矩形if shape_type == "rectangle":if group_id not in rectangles:rectangles[group_id] = {"label": label,"rect": points[0] + points[1], # Rectangle [x1, y1, x2, y2]"keypoints_list": []}# 遍历更新,将点加入对应group_id的矩形中,读关键点,根据group_id匹配for keypoint in keypoint_list:for shape in json_data["shapes"]:label = shape["label"]group_id = shape["group_id"]points = shape["points"]# 如果匹配到了对应的keypointif label == keypoint:rectangles[group_id]["keypoints_list"].append(points[0])#else:# rectangles[group_id]["keypoints_list"].append([0,0])# 转为yolo格式yolo_list = []for id, rectangle in rectangles.items():result_list = []if rectangle['label'] not in class_list:continuelabel_id = class_list.index(rectangle["label"])# x1,y1,x2,y2x1 ,y1 ,x2 ,y2 = rectangle["rect"]# center_x, center_y, width, heightcenter_x = (x1 +x2 ) /2center_y = (y1 +y2 ) /2width = abs(x1 -x2)height = abs(y1 -y2)# normalizecenter_x /= wcenter_y /= hwidth /= wheight /= h# 保留6位小数center_x = round(center_x, 6)center_y = round(center_y, 6)width = round(width, 6)height = round(height, 6)# 添加 label_id, center_x, center_y, width, heightresult_list = [label_id, center_x, center_y, width, height]# 添加 p1_x, p1_y, p1_v, p2_x, p2_y, p2_vfor point in rectangle["keypoints_list"]:x ,y = pointx ,y = int(x), int(y)x /= wy /= h# 保留6位小数x = round(x, 6)y = round(y, 6)result_list.extend([x ,y ,2])if len(rectangle["keypoints_list"]) == 4:result_list.extend([0, 0, 0])result_list.extend([0, 0, 0])result_list.extend([0, 0, 0])result_list.extend([0, 0, 0])result_list.extend([0, 0, 0])if len(rectangle["keypoints_list"]) == 2:result_list.extend([0, 0, 0])result_list.extend([0, 0, 0])result_list.extend([0, 0, 0])result_list.extend([0, 0, 0])result_list.extend([0, 0, 0])result_list.extend([0, 0, 0])result_list.extend([0, 0, 0])yolo_list.append(result_list)return yolo_list
# 获取所有的图片
img_list = glob.glob("D:/study/cnn/yolo/yolov8-mokpt/ultralytics/data_mokpt/*.png")
for img_path in tqdm.tqdm( img_list ):img = cv2.imread(img_path)print(img_path)json_file = img_path.replace('png', 'json')with open(json_file) as json_file:json_data = json.load(json_file)yolo_list = json_to_yolo(img, json_data)yolo_txt_path = img_path.replace('png', 'txt')with open(yolo_txt_path, "w") as f:for yolo in yolo_list:for i in range(len(yolo)):if i == 0:f.write(str(yolo[i]))else:f.write(" " + str(yolo[i]))f.write("\n")
运行上面代码,就可以获得TXT格式标签文件
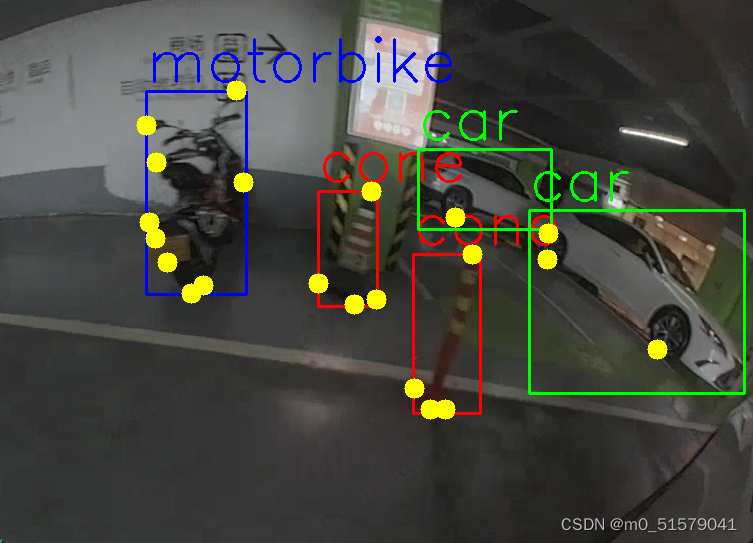
2.3.2 运行下面代码,检查txt标签转换是否正确
import os
import cv2
import numpy as np
import matplotlib.pyplot as plt
import globimg_path = "D:/study/cnn/yolo/yolov8-mokpt/ultralytics/data_mokpt/1.png"plt.figure(figsize=(15, 10))
img = cv2.imread(img_path)
plt.imshow(img[:, :, ::-1])
plt.axis('off')yolo_txt_path = img_path.replace('png', 'txt')
print(yolo_txt_path)with open(yolo_txt_path, 'r') as f:lines = f.readlines()lines = [x.strip() for x in lines]label = np.array([x.split() for x in lines], dtype=np.float32)# 物体类别
class_list = ["motorbike","car","cone"]# 类别的颜色
class_color = [(255, 0, 0), (0, 255, 0), (0, 0, 255), (255, 255, 0),(255, 0, 0), (0, 255, 0), (0, 0, 255), (255, 255, 0),(255, 0, 0), (0, 255, 0)]
# 关键点的顺序
keypoint_list = ["11", "22", "33", "44","55", "66", "77", "88", "99"]
# 关键点的颜色
keypoint_color = [(255, 0, 0), (0, 255, 0), (0, 0, 255), (255, 255, 0),(255, 0, 0), (0, 255, 0), (0, 0, 255), (255, 255, 0),(255, 0, 0), (0, 255, 0)]# 绘制检测框
img_copy = img.copy()
h, w = img_copy.shape[:2]
for id, l in enumerate(label):# label_id ,center x,y and width, heightlabel_id, cx, cy, bw, bh = l[0:5]label_text = class_list[int(label_id)]# rescale to image sizecx *= wcy *= hbw *= wbh *= h# draw the bounding boxxmin = int(cx - bw / 2)ymin = int(cy - bh / 2)xmax = int(cx + bw / 2)ymax = int(cy + bh / 2)cv2.rectangle(img_copy, (xmin, ymin), (xmax, ymax), class_color[int(label_id)], 2)cv2.putText(img_copy, label_text, (xmin, ymin - 10), cv2.FONT_HERSHEY_SIMPLEX, 1, class_color[int(label_id)], 2)# display the image
plt.figure(figsize=(15, 10))
plt.imshow(img_copy[:, :, ::-1])
plt.axis('off')
# save the image
cv2.imwrite("./tmp.png", img_copy)img_copy = img.copy()
h, w = img_copy.shape[:2]
for id, l in enumerate(label):# label_id ,center x,y and width, heightlabel_id, cx, cy, bw, bh = l[0:5]label_text = class_list[int(label_id)]# rescale to image sizecx *= wcy *= hbw *= wbh *= h# draw the bounding boxxmin = int(cx - bw / 2)ymin = int(cy - bh / 2)xmax = int(cx + bw / 2)ymax = int(cy + bh / 2)cv2.rectangle(img_copy, (xmin, ymin), (xmax, ymax), class_color[int(label_id)], 2)cv2.putText(img_copy, label_text, (xmin, ymin - 10), cv2.FONT_HERSHEY_SIMPLEX, 2, class_color[int(label_id)], 2)# draw 17 keypoints, px,py,pv,px,py,pv...for i in range(5, len(l), 3):px, py = l[i:i + 2]# rescale to image sizepx *= wpy *= h# puttext the indexindex = int((i - 5) / 2)# draw the keypointsif(int(px)>0):cv2.circle(img_copy, (int(px), int(py)), 10, (0,255,255), -1)plt.figure(figsize=(15, 10))
plt.imshow(img_copy[:, :, ::-1])
plt.axis('off')
# save
cv2.imwrite('./tmp.png', img_copy)
cv2.imshow('tmp', img_copy)
cv2.waitKey(0)
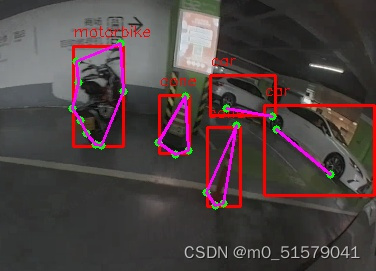
可视化结果如下
ultralytics\ultralytics\路径下,创建data文件夹,将图片和标签按下面的结构摆放:

三、配置文件设置
3.1 修改coco-pose.yaml
修改ultralytics\ultralytics\cfg\datasets\coco-pose.yaml配置文件内容:
path: ultralytics/data/images
train: train
val: val# Keypoints
# 9:多目标中关键点最多的那个关键点数量
# 3: x, y和关键点可见性
kpt_shape: [9, 3]
flip_idx: [0, 1, 2, 3,4,5,6,7,8,9]# Classes
names:0: motorbike1: car2: cone
四、训练
4.1 下载预训练权重
在YOLOv8 github上下载预训练权重:yolov8n-pose.pt,ultralytics\ultralytics\路径下,新建weight文件夹,预训练权重放入其中。

4.2 训练
步骤一:修改ultralytics\ultralytics\cfg\default.yaml文件中的训练参数(根据自己的实际情况决定)
步骤二:执行下面代码:
from ultralytics import YOLO# Load a model
model = YOLO('ultralytics/weights/yolov8n-pose.pt')# Train the model
results = model.train(data='D:/study/cnn/yolo/yolov8-mokpt/ultralytics/ultralytics/cfg/datasets/coco-pose.yaml', epochs=300, imgsz=640)
五、验证
from ultralytics import YOLOdef main():model = YOLO(r'runs/pose/train/weights/best.pt')model.val(data='data/multi-pose.yaml', imgsz=1024, batch=4, workers=4)
if __name__ == '__main__':main()
六、推理
根据自己实际的情况,修改
# 测试图片
from ultralytics import YOLO
import cv2
import numpy as np
import sys# 读取命令行参数
weight_path = 'E:/YOLO/yolov8-mokpt/ultralytics/runs/pose/best.pt'
media_path = "demo/bev_2_1034.png"# 加载模型
model = YOLO(weight_path)# 获取类别
objs_labels = model.names  # get class labels
print(objs_labels)# 类别的颜色
class_color = [(255, 0, 0), (0, 255, 0), (0, 0, 255), (255, 255, 0),(255, 0, 0), (0, 255, 0), (0, 0, 255), (255, 255, 0),(255, 0, 0), (0, 255, 0)]
# 关键点的顺序
class_list = ["motorbike","car","cone"]# 关键点的颜色
keypoint_color = [(255, 0, 0), (0, 255, 0),(255, 0, 0), (0, 255, 0),(255, 0, 0), (0, 255, 0),(255, 0, 0), (0, 255, 0),(255, 0, 0), (0, 255, 0)]# 读取图片
frame = cv2.imread(media_path)
frame = cv2.resize(frame, (frame.shape[1] // 2, frame.shape[0] // 2))
# rotate
# 检测
result = list(model(frame, conf=0.3, stream=True))[0]  # inference,如果stream=False,返回的是一个列表,如果stream=True,返回的是一个生成器
boxes = result.boxes  # Boxes object for bbox outputs
boxes = boxes.cpu().numpy()  # convert to numpy array# 遍历每个框
for box in boxes.data:l, t, r, b = box[:4].astype(np.int32)  # left, top, right, bottomconf, id = box[4:]  # confidence, classid = int(id)# 绘制框cv2.rectangle(frame, (l, t), (r, b), (0, 0, 255), 2)# 绘制类别+置信度(格式:98.1%)cv2.putText(frame, f"{objs_labels[id]} {conf * 100:.1f}", (l, t - 10), cv2.FONT_HERSHEY_SIMPLEX, 0.5,(0, 0, 255), 1)# 遍历keypoints
keypoints = result.keypoints  # Keypoints object for pose outputs
keypoints = keypoints.cpu().numpy()  # convert to numpy array# draw keypoints, set first keypoint is red, second is blue
for keypoint in keypoints.data:for i in range(len(keypoint)):x, y ,_ = keypoint[i]x, y = int(x), int(y)cv2.circle(frame, (x, y), 3, (0, 255, 0), -1)#cv2.putText(frame, f"{keypoint_list[i]}", (x, y - 10), cv2.FONT_HERSHEY_SIMPLEX, 1, keypoint_color[i], 2)if len(keypoint) >= 2:# draw arrow line from tail to half between head and tailx0, y0 ,_= keypoint[0]x1, y1 ,_= keypoint[1]x2, y2 ,_= keypoint[2]x3, y3 ,_= keypoint[3]x4, y4 ,_= keypoint[4]x5, y5 ,_= keypoint[5]x6, y6 ,_= keypoint[6]x7, y7 ,_= keypoint[7]x8, y8 ,_= keypoint[8]cv2.line(frame, (int(x0), int(y0)), (int(x1), int(y1)), (255, 0, 255), 1)cv2.line(frame, (int(x1), int(y1)), (int(x2), int(y2)), (255, 0, 255), 1)cv2.line(frame, (int(x2), int(y2)), (int(x3), int(y3)), (255, 0, 255), 1)cv2.line(frame, (int(x3), int(y3)), (int(x4), int(y4)), (255, 0, 255), 1)cv2.line(frame, (int(x4), int(y4)), (int(x5), int(y5)), (255, 0, 255), 1)cv2.line(frame, (int(x5), int(y5)), (int(x6), int(y6)), (255, 0, 255), 1)cv2.line(frame, (int(x6), int(y6)), (int(x7), int(y7)), (255, 0, 255), 1)cv2.line(frame, (int(x7), int(y7)), (int(x8), int(y8)), (255, 0, 255), 1)cv2.line(frame, (int(x8), int(y8)), (int(x0), int(y0)), (255, 0, 255), 1)#center_x, center_y = (x1 + x2) / 2, (y1 + y2) / 2# cv2.arrowedLine(frame, (int(x2), int(y2)), (int(center_x), int(center_y)), (255, 0, 255), 4,#                line_type=cv2.LINE_AA, tipLength=0.1)# save image
cv2.imwrite("result.jpg", frame)
print("save result.jpg")
这篇关于【保姆级教程】YOLOv8_Pose多目标+关键点检测:训练自己的数据集的文章就介绍到这儿,希望我们推荐的文章对编程师们有所帮助!


