本文主要是介绍使用Python,maplotlib绘制树型有向层级结构图,希望对大家解决编程问题提供一定的参考价值,需要的开发者们随着小编来一起学习吧!
使用Python,maplotlib绘制树型有向层级结构图
- 1. 效果图
- 2. 源码
- 2.1 plotTree.py绘制层级结构及不同样式
- 2.2 plotArrow.py 支持的所有箭头样式
- 参考
前俩篇博客介绍了
1. 使用Python,networkx对卡勒德胡赛尼三部曲之《群山回唱》人物关系图谱绘制
2. 使用Python,networkx绘制有向层级结构图
3. 使用Python,maplotlib绘制树型有向层级结构图 这篇博客是绘制层级结构图三部曲最后一篇。
1. 效果图
按父子层级结构绘制图形,并标记之间的关联关系,并根据不同标签绘制不同颜色箭头(hello的蓝色箭头,bad的红色箭头,默认绿色箭头),效果图如下:
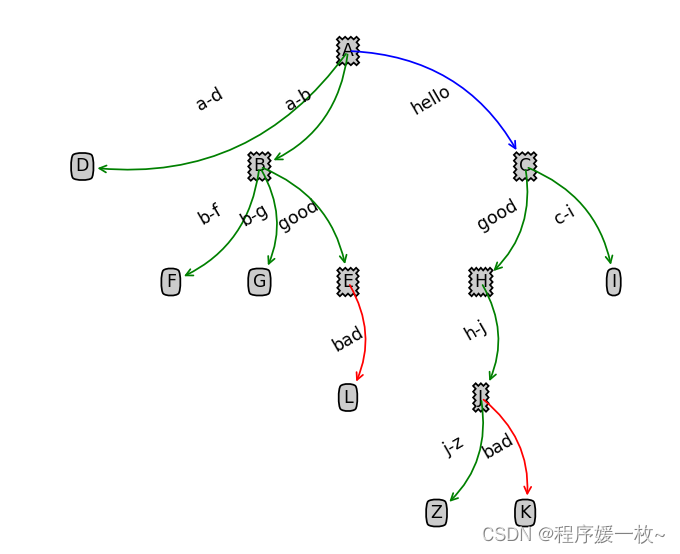
同样是表达层级结构关系,可以很明显的看出来这比上篇博客使用networkx绘制的层级图要清楚很多,一目了然。
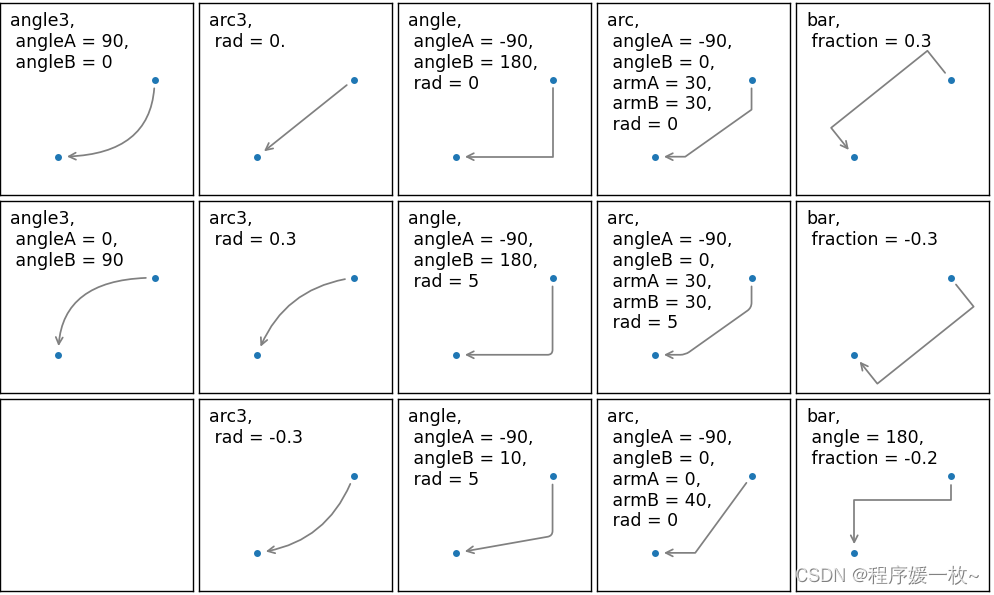
不同箭头样式:
支持的所有箭头及箭头弯曲程度样式如下:
2. 源码
2.1 plotTree.py绘制层级结构及不同样式
# python plotTree.py
# 绘制层级结构图,并根据标签值对树绘制不同颜色import matplotlib.pyplot as pltplt.rcParams['backend'] = 'TkAgg'
decisionNode = dict(boxstyle="sawtooth", fc="0.8")
leafNode = dict(boxstyle="round4", fc="0.8")def getNumLeafs(myTree):numLeafs = 0firstStr = list(myTree.keys())[0]secondDict = myTree[firstStr]for key in secondDict.keys():if type(secondDict[key]).__name__ == 'dict':  # test to see if the nodes are dictonaires, if not they are leaf nodesnumLeafs += getNumLeafs(secondDict[key])else:numLeafs += 1return numLeafsdef getTreeDepth(myTree):maxDepth = 0firstStr = list(myTree.keys())[0]secondDict = myTree[firstStr]for key in secondDict.keys():if type(secondDict[key]).__name__ == 'dict':  # test to see if the nodes are dictonaires, if not they are leaf nodesthisDepth = 1 + getTreeDepth(secondDict[key])else:thisDepth = 1if thisDepth > maxDepth: maxDepth = thisDepthreturn maxDepthdef plotNode(nodeTxt, centerPt, parentPt, nodeType, color):# 分别表示箭头的样式,俩边距离边框的值,以及箭头线的弯曲程度,箭头的颜色arrow_args = dict(arrowstyle="<-", shrinkA=10, shrinkB=10, patchA=None, patchB=None, connectionstyle="arc3,rad=0.3",color=color)arrow_args = dict(arrowstyle="<-", shrinkA=10, shrinkB=10, patchA=None, patchB=None, connectionstyle="arc3, rad = 0.",color=color)createPlot.ax1.annotate(nodeTxt, xy=parentPt, xycoords='axes fraction',xytext=centerPt, textcoords='axes fraction',va="center", ha="center", bbox=nodeType, arrowprops=arrow_args)def plotMidText(cntrPt, parentPt, txtString):xMid = (parentPt[0] - cntrPt[0]) / 2.0 + cntrPt[0]yMid = (parentPt[1] - cntrPt[1]) / 2.0 + cntrPt[1]createPlot.ax1.text(xMid, yMid, txtString, va="center", ha="center", rotation=30)def getArrowColors(parentNode, firstStr, edgeDict):key = parentNode + '->' + firstStrif not edgeDict.__contains__(key):color = 'black'elif edgeDict[key].__contains__('hello'):color = 'blue'elif edgeDict[key].__contains__('bad'):color = 'red'else:color = 'green'return colordef getArrowAttrTxt(parentNode, firstStr, edgeDict):key = parentNode + '->' + firstStrif not edgeDict.__contains__(key):return ''return edgeDict[key]def plotTree(myTree, parentPt, parentNode, nodeTxt):numLeafs = getNumLeafs(myTree)depth = getTreeDepth(myTree)firstStr = list(myTree.keys())[0]cntrPt = (plotTree.xOff + (1.0 + float(numLeafs)) / 2.0 / plotTree.totalW, plotTree.yOff)plotMidText(cntrPt, parentPt, getArrowAttrTxt(parentNode, firstStr, edgeDict))plotNode(firstStr, cntrPt, parentPt, decisionNode, getArrowColors(parentNode, firstStr, edgeDict))secondDict = myTree[firstStr]plotTree.yOff = plotTree.yOff - 1.0 / plotTree.totalDfor key in secondDict.keys():if type(secondDict[key]).__name__ == 'dict':print("++++++++++++: ", key, firstStr)plotTree(secondDict[key], cntrPt, firstStr, str(key))  # recursionelse:print('----: ', secondDict[key], firstStr, key)plotTree.xOff = plotTree.xOff + 1.0 / plotTree.totalWplotNode(secondDict[key], (plotTree.xOff, plotTree.yOff), cntrPt, leafNode,getArrowColors(firstStr, secondDict[key], edgeDict))plotMidText((plotTree.xOff, plotTree.yOff), cntrPt, getArrowAttrTxt(firstStr, secondDict[key], edgeDict))plotTree.yOff = plotTree.yOff + 1.0 / plotTree.totalDdef createPlot(inTree):fig = plt.figure(1, facecolor='white')fig.clf()axprops = dict(xticks=[], yticks=[])createPlot.ax1 = plt.subplot(111, frameon=False, **axprops)  # no ticks# createPlot.ax1 = plt.subplot(111, frameon=False) #ticks for demo puropsesplotTree.totalW = float(getNumLeafs(inTree))plotTree.totalD = float(getTreeDepth(inTree))plotTree.xOff = -0.5 / plotTree.totalW;plotTree.yOff = 1.0;plotTree(inTree, (0.5, 1.0), 'A', '')plt.show()def retrieveTree(i):listOfTrees = [{'no surfacing': {0: 'no', 1: {'flippers': {0: 'no', 1: 'yes'}}}},{'no surfacing': {0: 'no', 1: {'flippers': {0: {'head': {0: 'no', 1: 'yes'}}, 1: 'no'}}}}]return listOfTrees[i]def getTree(treeDict, nood):retrieveTree = {}for i, val in enumerate(treeDict[nood]):print(i, nood, val)if (treeDict.__contains__(val)):subTree = {}subTree[val] = getTree(treeDict, val)retrieveTree[i] = subTreeelse:retrieveTree[i] = valreturn retrieveTreedef getRetrieveTree():treeDict = {}edgeDict = {}with open("res/tree.txt", 'r', encoding='utf-8', errors='ignore') as f:data = f.readlines()for i, line in enumerate(data):parentNode = line.split(",")[0]childNode = line.split(",")[1]edgeDict[parentNode + "->" + childNode] = line.split(",")[2]# print(parentNode, childNode)if not treeDict.__contains__(parentNode):treeDict[parentNode] = set()treeDict[parentNode].add(childNode)print(treeDict)treeDict0 = {}treeDict0['A'] = getTree(treeDict, 'A')# print(treeDict0)return (treeDict0, edgeDict)# treeDemo = retrieveTree(1)
# print(treeDemo)
# createPlot(treeDemo)
(treeDict, edgeDict) = getRetrieveTree()
print(treeDict)
createPlot(treeDict)
2.2 plotArrow.py 支持的所有箭头样式
# python plotArrow.py
from matplotlib import pyplot as pltprint(plt.rcParams['backend'])  # module://backend_interagg
plt.rcParams['backend'] = 'TkAgg'def demo_con_style(ax, connectionstyle):x1, y1 = 0.3, 0.2x2, y2 = 0.8, 0.6ax.plot([x1, x2], [y1, y2], ".")ax.annotate("", xy=(x1, y1), xycoords='data',xytext=(x2, y2), textcoords='data',arrowprops=dict(arrowstyle="->", color="0.5",shrinkA=5, shrinkB=5,patchA=None, patchB=None,connectionstyle=connectionstyle,),)ax.text(.05, .95, connectionstyle.replace(",", ",\n"),transform=ax.transAxes, ha="left", va="top")fig, axs = plt.subplots(3, 5, figsize=(8, 4.8))
demo_con_style(axs[0, 0], "angle3, angleA = 90, angleB = 0")
demo_con_style(axs[1, 0], "angle3, angleA = 0, angleB = 90")
demo_con_style(axs[0, 1], "arc3, rad = 0.")
demo_con_style(axs[1, 1], "arc3, rad = 0.3")
demo_con_style(axs[2, 1], "arc3, rad = -0.3")
demo_con_style(axs[0, 2], "angle, angleA = -90, angleB = 180, rad = 0")
demo_con_style(axs[1, 2], "angle, angleA = -90, angleB = 180, rad = 5")
demo_con_style(axs[2, 2], "angle, angleA = -90, angleB = 10, rad = 5")
demo_con_style(axs[0, 3], "arc, angleA = -90, angleB = 0, armA = 30, armB = 30, rad = 0")
demo_con_style(axs[1, 3], "arc, angleA = -90, angleB = 0, armA = 30, armB = 30, rad = 5")
demo_con_style(axs[2, 3], "arc, angleA = -90, angleB = 0, armA = 0, armB = 40, rad = 0")
demo_con_style(axs[0, 4], "bar, fraction = 0.3")
demo_con_style(axs[1, 4], "bar, fraction = -0.3")
demo_con_style(axs[2, 4], "bar, angle = 180, fraction = -0.2")for ax in axs.flat:ax.set(xlim=(0, 1), ylim=(0, 1), xticks=[], yticks=[], aspect=1)
fig.tight_layout(pad=0.2)plt.show()
参考
- https://blog.csdn.net/weixin_42915773/article/details/111566041
- https://blog.csdn.net/TQCAI666/article/details/103689182
这篇关于使用Python,maplotlib绘制树型有向层级结构图的文章就介绍到这儿,希望我们推荐的文章对编程师们有所帮助!


