前言
之前发在ickey社区上的一系列文章:
- 犹抱琵琶半遮面,无人知是荔枝来——unboxing & interview 一、二、三
- 葡萄美酒夜光杯,巧妇难为无米炊——资料与社区
- 一支穿云箭,板子要加散热片——系统监控与发热问题
- 念去去千里烟波,暮霭沉沉楚天阔——远程控制相关
- 竹喧归浣女,莲动小轻舟——延长板载eMMC寿命、优化性能
RPi-Monitor简介
前文 讲到如何通过一个shell脚本获取CPU状态和PMU温度,而RPi-Monitor基于perl,内置webserver,通过优化后对sd卡占用更少。由于其极强的可定制性与拓展性,你可以换用熟悉的Web Server,显示服务状态,甚至作为视频监控。最早是基于树莓派的项目,后来在XApple社区发现有人移植到蓮霧派,今天cnx-software也报道了,特此记录下来。之前都是使用的phpsysinfo
项目主页:http://rpi-experiences.blogspot.com/
Github主页: https://github.com/XavierBerger/RPi-Monitor
开始页面:

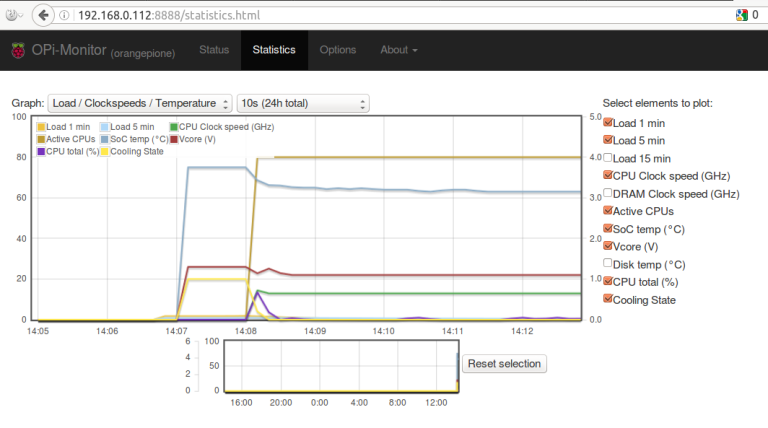
统计页面:
安装配置
添加rpimonitor源
sudo -s
apt-get install apt-transport-https ca-certificates
wget https://raw.githubusercontent.com/XavierBerger/RPi-Monitor/master/init/apt/sources.list.d/rpimonitor.list -O /etc/apt/sources.list.d/rpimonitor.list
apt-key adv --recv-keys --keyserver keyserver.ubuntu.com 2C0D3C0F
安装升级RPi-Monitor
apt-get update && apt-get install rpimonitor && apt-get upgrade停止服务添加自定义模块
systemctl stop rpimonitor
nano /etc/rpimonitor/template/S500_ATC2603.conf
输入以下内容:
########################################################################
# Extract S500/ATC2603 information
#  Page: 1
#  Information               Status     Statistics
#  - cpu frequency           - yes      - yes
#  - cpu load 1, 5, 15       - yes      - yes
#  - cpu scaling governor    - yes      - no
#  - power in voltage        - yes      - yes
#  - power in consumption    - yes      - yes
#  - USB OTG voltage         - yes      - yes
#  - USB OTG consumption     - yes      - yes
#  - battery consumption     - yes      - yes
#  - total consumption       - yes      - yes
#  - power in current        - yes      - yes
#  - USB OTG current         - yes      - yes
#  - soc temperature         - yes      - yes
#  - pmu temperature         - yes      - yes
########################################################################
dynamic.1.name=cpu_frequency
dynamic.1.source=/sys/devices/system/cpu/cpu0/cpufreq/cpuinfo_cur_freq
dynamic.1.regexp=(.*)
dynamic.1.postprocess=$1/1000
dynamic.1.rrd=GAUGEdynamic.2.name=load1,load5,load15
dynamic.2.source=/proc/loadavg
dynamic.2.regexp=^(\S+)\s(\S+)\s(\S+)
dynamic.2.postprocess=
dynamic.2.rrd=GAUGEdynamic.3.name=scaling_governor
dynamic.3.source=/sys/devices/system/cpu/cpu0/cpufreq/scaling_governor
dynamic.3.regexp=(.*)
dynamic.3.postprocess=
dynamic.3.rrd=dynamic.4.name=ac_voltage
dynamic.4.source=/sys/devices/b0170000.i2c/i2c-0/0-0065/atc2603c-hwmon.0/wall_voltage
dynamic.4.regexp=(.*)
dynamic.4.postprocess=sprintf("%.2f", $1/1000)
dynamic.4.rrd=GAUGEdynamic.5.name=ac_consumption
dynamic.5.source=/sys/devices/b0170000.i2c/i2c-0/0-0065/atc2603c-hwmon.0/wall_current
dynamic.5.regexp=(.*)
dynamic.5.postprocess=sprintf("%.2f", $1/153 * $this->{'dynamic'}->{'ac_voltage'})
dynamic.5.rrd=GAUGEdynamic.6.name=usb_voltage
dynamic.6.source=/sys/devices/b0170000.i2c/i2c-0/0-0065/atc2603c-hwmon.0/vbus_voltage
dynamic.6.regexp=(.*)
dynamic.6.postprocess=sprintf("%.2f", $1/1000)
dynamic.6.rrd=GAUGEdynamic.7.name=usb_consumption
dynamic.7.source=/sys/devices/b0170000.i2c/i2c-0/0-0065/atc2603c-hwmon.0/vbus_current
dynamic.7.regexp=(.*)
dynamic.7.postprocess=sprintf("%.2f", $1/1000 * $this->{'dynamic'}->{'usb_voltage'})
dynamic.7.rrd=GAUGEdynamic.8.name=battery_consumption
dynamic.8.source=/sys/devices/b0170000.i2c/i2c-0/0-0065/atc2603c-hwmon.0/bat_current
dynamic.8.regexp=(.*)
dynamic.8.postprocess=sprintf("%.2f", $1/1000)
dynamic.8.rrd=GAUGEdynamic.9.name=total_consumption
dynamic.9.source=/sys/devices/b0170000.i2c/i2c-0/0-0065/atc2603c-hwmon.0/bat_voltage
dynamic.9.regexp=(.*)
dynamic.9.postprocess=sprintf("%.2f", $1/1000 + $this->{'dynamic'}->{'ac_consumption'} + $this->{'dynamic'}->{'usb_consumption'})
dynamic.9.rrd=GAUGEdynamic.10.name=usb_current
dynamic.10.source=/sys/devices/b0170000.i2c/i2c-0/0-0065/atc2603c-hwmon.0/vbus_current
dynamic.10.regexp=(.*)
dynamic.10.postprocess=sprintf("%.2f", $1/1000)
dynamic.10.rrd=GAUGEdynamic.11.name=ac_current
dynamic.11.source=/sys/devices/b0170000.i2c/i2c-0/0-0065/atc2603c-hwmon.0/wall_current
dynamic.11.regexp=(.*)
dynamic.11.postprocess=sprintf("%.2f", $1/153)
dynamic.11.rrd=GAUGEdynamic.12.name=soc_temp
dynamic.12.source=/sys/devices/virtual/thermal/thermal_zone1/temp
dynamic.12.regexp=(.*)
dynamic.12.postprocess=sprintf("%.1f", $1/1000)
dynamic.12.rrd=GAUGEdynamic.13.name=pmu_temp
dynamic.13.source=/sys/devices/b0170000.i2c/i2c-0/0-0065/atc2603c-hwmon.0/ic_temperature
dynamic.13.regexp=(.*)
dynamic.13.postprocess=sprintf("%.1f", $1/1000)
dynamic.13.rrd=GAUGEweb.status.1.content.1.name=CPU
web.status.1.content.1.icon=cpu.png
web.status.1.content.1.line.1="Loads: <b>" + data.load1 + "</b> [1min] - <b>" + data.load5 + "</b> [5min] - <b>" + data.load15 + "</b> [15min]"
web.status.1.content.1.line.2="CPU frequency: <b>" + data.cpu_frequency + "MHz</b>  Governor: <b>" + data.scaling_governor + "</b>"web.status.1.content.2.name=PMU
web.status.1.content.2.icon=pmu.png
web.status.1.content.2.line.1="Total PMU Consumption: <b>" + data.total_consumption + " W</b>"
web.status.1.content.2.line.2="PWR in: <b>" + data.ac_consumption + " W</b> USB OTG in: <b>" + data.usb_consumption + " W</b> BATT in: <b>" + data.battery_consumption + " W</b>"web.status.1.content.3.name=Temperature
web.status.1.content.3.icon=cpu_temp.png
web.status.1.content.3.line.1=JustGageBar("SoC", "°C",0, data.soc_temp , 125,100,80,percentColors,70,85)+" "+JustGageBar("PMU", "°C",0, data.pmu_temp , 125,100,80,percentColors,70,85)web.statistics.1.content.1.name=Load / cpufreq / Consumption
web.statistics.1.content.1.graph.1=load1
web.statistics.1.content.1.graph.2=load5
web.statistics.1.content.1.graph.3=load15
web.statistics.1.content.1.graph.4=total_consumption
web.statistics.1.content.1.graph.5=cpu_frequency
web.statistics.1.content.1.ds_graph_options.load1.label=Load 1 min
web.statistics.1.content.1.ds_graph_options.load5.label=Load 5 min
web.statistics.1.content.1.ds_graph_options.load15.label=Load 15 min
web.statistics.1.content.1.ds_graph_options.total_consumption.label=Consumption (W)
web.statistics.1.content.1.ds_graph_options.cpu_frequency.label=Clock speed (MHz)
web.statistics.1.content.1.ds_graph_options.cpu_frequency.yaxis=2
web.statistics.1.content.1.graph_options.y2axis={ position: "right" }web.statistics.1.content.2.name=PMU current/voltage
web.statistics.1.content.2.graph.1=ac_voltage
web.statistics.1.content.2.graph.2=usb_voltage
web.statistics.1.content.2.graph.3=ac_current
web.statistics.1.content.2.graph.4=usb_current
web.statistics.1.content.2.graph.5=battery_consumption
web.statistics.1.content.2.ds_graph_options.ac_voltage.label=Voltage PWR in (V)
web.statistics.1.content.2.ds_graph_options.usb_voltage.label=Voltage USB OTG (V)
web.statistics.1.content.2.ds_graph_options.ac_current.label=Current PWR in (A)
web.statistics.1.content.2.ds_graph_options.usb_current.label=Current USB OTG (mA)
web.statistics.1.content.2.ds_graph_options.battery_consumption.label=Consumption Battery (W)
web.statistics.1.content.2.ds_graph_options.ac_voltage.yaxis=1
web.statistics.1.content.2.ds_graph_options.usb_voltage.yaxis=1
web.statistics.1.content.2.ds_graph_options.ac_current.yaxis=2
web.statistics.1.content.2.ds_graph_options.usb_current.yaxis=2
web.statistics.1.content.2.ds_graph_options.battery_consumption.yaxis=1
web.statistics.1.content.2.graph_options.y1axis={ position: "left", min: 1.5, max: 11 }
web.statistics.1.content.2.graph_options.y2axis={ position: "right" }web.statistics.1.content.3.name=Temperature / Consumption
web.statistics.1.content.3.graph.1=pmu_temp
web.statistics.1.content.3.graph.2=soc_temp
web.statistics.1.content.3.graph.3=total_consumption
web.statistics.1.content.3.ds_graph_options.pmu_temp.label=PMU temperature (°C)
web.statistics.1.content.3.ds_graph_options.soc_temp.label=SoC temperature (°C)
web.statistics.1.content.3.ds_graph_options.total_consumption.label=Consumption (W)
web.statistics.1.content.3.ds_graph_options.total_consumption.yaxis=2
web.statistics.1.content.3.graph_options.y1axis={ position: "left", min: 0, max: 125 }
web.statistics.1.content.3.graph_options.y2axis={ position: "right" }
nano /etc/rpimonitor/template/lemaker_guitar.conf添加以下内容,创建主配置文件,根据自己需要启用|禁用模块:
web.page.icon='img/logo.png'
web.page.menutitle='RPi-Monitor  <sub>('+data.hostname+')</sub>'
web.page.pagetitle='RPi-Monitor ('+data.hostname+')'web.status.1.name=lemaker_guitar
web.statistics.1.name=lemaker_guitarinclude=/etc/rpimonitor/template/version.conf
include=/etc/rpimonitor/template/uptime.conf
include=/etc/rpimonitor/template/S500_ATC2603.conf
include=/etc/rpimonitor/template/memory.conf
include=/etc/rpimonitor/template/swap.conf
include=/etc/rpimonitor/template/sdcard.conf
include=/etc/rpimonitor/template/network.conf
include=/etc/rpimonitor/template/wlan.conf
创建软链接:
ln -sf /etc/rpimonitor/template/lemaker_guitar.conf /etc/rpimonitor/data.conf重启rpimonitor服务
systemctl start rpimonitor访问网页前端
假如Guitar的IP为192.168.1.111,那么在浏览器里输入192.168.1.111:8888 即可打开状态页面。经过配置可以远程访问Guitar之后,无论身处何地都可以及时监控Guitar的运行状态。
软件使用GPL3 协议,所以可以对界面进行一些改造。
自定义功能与添加模块
使用配置文件生成助手
2.6版本之后引入了一个新工具:RPi-Monitor交互式配置文件生成助手 (RPi-Monitor Interactive Configuration Helper),通过运行
rpimonitord -i可以非常方便地创建自己的监视点。Via
添加传感器数据
以DHT温湿度传感器为例,可以监视温湿度变化,绘制折线图,修改之后可以显示诸多传感器数值。Via
使用标签显示状态
2.7版本之后引入标签显示服务状态的功能,支持6种颜色:
效果如图所示:
根据模板修改/etc/rpimonitor/template/services.conf文件即可。稍加改造可以实现更多功能。
注意:最新2.10版/etc/rpimonitor/template/services.conf文件最后一行少一个")",需要自己补上。
nano中可通过Ctrl+E快速跳至行尾。Via
进阶用法
其他进阶用法及自定义功能。Via
其他模板
- 全志A10/A13/A20
- 全志H3
- A64 (Pine64)
A83T/H8 (Banana Pi M3, Cubietruck +)
via总结


