本文主要是介绍Echarts实现3D柱状图,希望对大家解决编程问题提供一定的参考价值,需要的开发者们随着小编来一起学习吧!
Echarts实现3D柱状图
- 效果图
- 代码
效果图
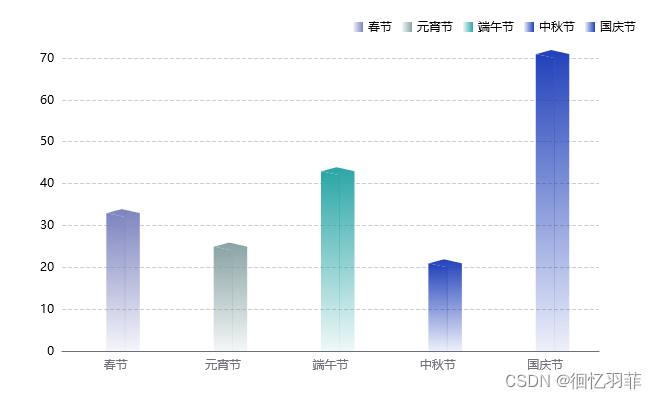
代码
<!--此示例下载自 https://echarts.apache.org/examples/zh/editor.html?c=bar3d-dataset&gl=1
-->
<!DOCTYPE html>
<html lang="en" style="height: 100%">
<head><meta charset="utf-8"><title>Echarts实现3D柱状图 - qipa250</title>
</head>
<body style="height: 100%; margin: 0">
<div id="qipa250" style="height: 100%"></div><script type="text/javascript" src="https://cdn.staticfile.org/jquery/3.7.1/jquery.min.js"></script>
<!--
<script type="text/javascript" src="https://registry.npmmirror.com/echarts/5.4.3/files/dist/echarts.min.js"></script>
-->
<script type="text/javascript" src="https://cdn.jsdelivr.net/npm/echarts@5.4.1/dist/echarts.min.js"></script>
<!--  www.qipa250.com 奇葩天地网--><script type="text/javascript">var chartDom = document.getElementById('qipa250');var myChart = echarts.init(chartDom);var option;const labels = ['春节', '元宵节', '端午节', '中秋节', '国庆节'];const seriesData = [{label: '春节',value: [32],},{label: '元宵节',value: [24],},{label: '端午节',value: [42],},{label: '中秋节',value: [20],},{label: '国庆节',value: [70],}]const colors = [[{offset: 0, color: 'rgba(126, 132, 191, 1)'},{offset: 1, color: 'rgba(126, 132, 191, 0.08)'},],[{offset: 0, color: 'rgba(137, 163, 164, 1)'},{offset: 1, color: 'rgba(137, 163, 164, 0.09)'},],[{offset: 0, color: 'rgba(44, 166, 166, 1)'},{offset: 1, color: 'rgba(44, 166, 166, 0.08)'},],[{offset: 0, color: 'rgba(34, 66, 186, 1)'},{offset: 1, color: 'rgba(34, 66, 186, 0.08)'},],[{offset: 0, color: 'rgba(34, 66, 186, 1)'},{offset: 1, color: 'rgba(34, 66, 186, 0.08)'},],];option = {xAxis: {axisTick: {show: false},nameTextStyle: {color: '#fff'},data: labels,},legend: {data: getlegendData(),right: '25',top: '18',icon: 'rect',itemHeight: 10,itemWidth: 10,textStyle: {color: '#000'}},yAxis: {type: 'value',axisLabel: {color: '#000'},splitLine: {show: true,lineStyle: {type: 'dashed',color: ['#ccc']}}},series: getSeriesData()};// 定义柱状图左侧图形元素const leftRect = echarts.graphic.extendShape({shape: {x: 0,y: 0,width: 19, //柱状图宽zWidth: 8, //阴影折角宽zHeight: 4 //阴影折角高},buildPath: function (ctx, shape) {const api = shape.api;const xAxisPoint = api.coord([shape.xValue, 0]);const p0 = [shape.x - shape.width / 2, shape.y - shape.zHeight];const p1 = [shape.x - shape.width / 2, shape.y - shape.zHeight];const p2 = [xAxisPoint[0] - shape.width / 2, xAxisPoint[1]];const p3 = [xAxisPoint[0] + shape.width / 2, xAxisPoint[1]];const p4 = [shape.x + shape.width / 2, shape.y];ctx.moveTo(p0[0], p0[1]);ctx.lineTo(p1[0], p1[1]);ctx.lineTo(p2[0], p2[1]);ctx.lineTo(p3[0], p3[1]);ctx.lineTo(p4[0], p4[1]);ctx.lineTo(p0[0], p0[1]);ctx.closePath();}});// 定义柱状图右侧以及顶部图形元素const rightRect = echarts.graphic.extendShape({shape: {x: 0,y: 0,width: 18,zWidth: 15,zHeight: 8},buildPath: function (ctx, shape) {const api = shape.api;const xAxisPoint = api.coord([shape.xValue, 0]);const p1 = [shape.x - shape.width / 2, shape.y - shape.zHeight / 2];const p3 = [xAxisPoint[0] + shape.width / 2, xAxisPoint[1]];const p4 = [shape.x + shape.width / 2, shape.y];const p5 = [xAxisPoint[0] + shape.width / 2 + shape.zWidth, xAxisPoint[1]];const p6 = [shape.x + shape.width / 2 + shape.zWidth,shape.y - shape.zHeight / 2];const p7 = [shape.x - shape.width / 2 + shape.zWidth,shape.y - shape.zHeight];ctx.moveTo(p4[0], p4[1]);ctx.lineTo(p3[0], p3[1]);ctx.lineTo(p5[0], p5[1]);ctx.lineTo(p6[0], p6[1]);ctx.lineTo(p4[0], p4[1]);ctx.moveTo(p4[0], p4[1]);ctx.lineTo(p6[0], p6[1]);ctx.lineTo(p7[0], p7[1]);ctx.lineTo(p1[0], p1[1]);ctx.lineTo(p4[0], p4[1]);ctx.closePath();}});// 注册图形元素echarts.graphic.registerShape('leftRect', leftRect);echarts.graphic.registerShape('rightRect', rightRect);function getlegendData() {const data = [];labels.forEach((item, index) => {data.push({name: item,itemStyle: {color: new echarts.graphic.LinearGradient(1, 0, 0, 0, colors[index]),},})})return data}function getSeriesData() {const data = [];seriesData.forEach((item, index) => {data.push({type: 'custom',name: item.label,renderItem: function (params, api) {return getRenderItem(params, api);},data: item.value,itemStyle: {color: () => {return new echarts.graphic.LinearGradient(0, 0, 0, 1, colors[index]);},},})})return data}function getRenderItem(params, api) {const index = params.seriesIndex;let location = api.coord([api.value(0) + index, api.value(1)]);var extent = api.size([0, api.value(1)]);return {type: 'group',children: [{type: 'leftRect',shape: {api,xValue: api.value(0) + index,yValue: api.value(1),x: location[0],y: location[1]},style: api.style()},{type: 'rightRect',shape: {api,xValue: api.value(0) + index,yValue: api.value(1),x: location[0],y: location[1]},style: api.style()}]};}option && myChart.setOption(option);window.addEventListener('resize', myChart.resize);</script>
</body>
</html>
这篇关于Echarts实现3D柱状图的文章就介绍到这儿,希望我们推荐的文章对编程师们有所帮助!


