本文主要是介绍决策树以及XGBoost 树分裂图的多种可视化工具盘点,希望对大家解决编程问题提供一定的参考价值,需要的开发者们随着小编来一起学习吧!
之前有专门研究过,在各自的文中,这里进行罗列:
文章目录
- 1 pydotplus安装
- 2 XGBoost画出分裂图
- 3 决策树画出分裂图
- 4 高度可视化:dtree_viz
- 4.1 案例
- 4.2 单样本分析
- 4.3 具有的参数
- 5 dtreeplot
- 6 scikit-learn + graphviz 自己DIY画图
- 6.1 来源
- 6.2 代码
1 pydotplus安装
文档:PyDotPlus Homepage
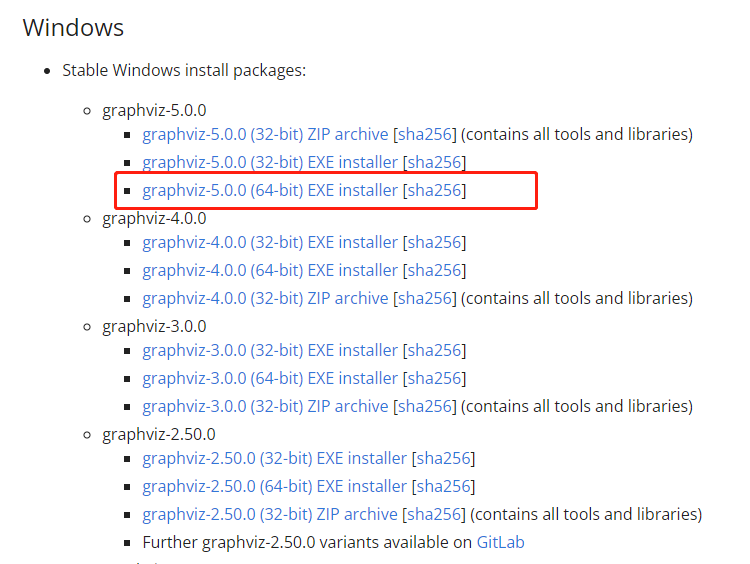
如果要画出决策树图,一般需要该库,需要先下载:
http://www.graphviz.org/download/

然后记住下载的路径,
pip install pydotplus
就可以按下面使用了:
import os
os.environ["PATH"] += os.pathsep + 'C:\\Desktop\\Graphviz\\bin\\'
import pydotplus
2 XGBoost画出分裂图
R+python︱XGBoost极端梯度上升以及forecastxgb(预测)+xgboost(回归)双案例解读
如果y是分类变量,可以直接画出节点图:
from matplotlib import pyplot
from xgboost import plot_tree
plot_tree(gbm, num_trees=0, rankdir='LR')
pyplot.show()
可以直接通过plot_tree画出节点图,但是plot_tree很丑,很模糊!
一种解决方案,参考https://github.com/dmlc/xgboost/issues/1725:
xgb.plot_tree(bst, num_trees=2)
fig = matplotlib.pyplot.gcf()
fig.set_size_inches(150, 100)
fig.savefig('tree.png')
于是乎,就需要来一张清晰一些的图片还有一种画法如下:
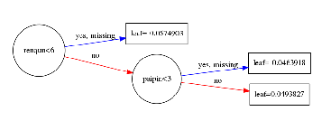
xgb.to_graphviz(gbm, num_trees=80, rankdir='LR')

来观察一下图型:
其中分支代表,category<5,两条路,代表条件成立,yes;条件不成立,no
每个节点都带有节点名,但是圆圈的大小,有人说是样本量越大,圆圈越大,也有可能是根据节点名称的多少来划定。
如何把图形输出出来:from graphviz import Digraph(参考:如何画XGBoost里面的决策树(decision tree))
参数界面:https://xgboost.readthedocs.io/en/latest/python/python_api.html
3 决策树画出分裂图
决策树之ID3、C4.5、C5.0等五大算法及python实现
from sklearn.datasets import load_iris
from sklearn import tree
import sys
import os
from IPython.display import Image as Images
import pydotplus
from PIL import Image, ImageDraw, ImageFont
from io import BytesIO
import numpy as npimport os
os.environ["PATH"] += os.pathsep + 'C:\\Desktop\\Graphviz\\bin\\'iris = load_iris()
clf = tree.DecisionTreeClassifier()
clf = clf.fit(iris.data, iris.target)dot_data = tree.export_graphviz(clf, out_file=None, feature_names=iris.feature_names,  class_names=iris.target_names,  filled=True, rounded=True,  special_characters=True)
graph = pydotplus.graph_from_dot_data(dot_data)  Images(graph.create_png())
在ipython的notebook生成的图如下:

其中解析一下这张图:
通过剪枝,把很多不必要的枝叶进行删减,保留有效节点;根据gini系数来判定节点,划分最优属性,gini越大,分割贡献越大,越容易成为高层节点。
颜色信息,这边
- virginica——紫色/2;
- versicolor——绿色/1;
- setosa——橙色/0。
gini系数的大小,代表颜色的深浅,gini越大,颜色越浅。
samples代表这个节点的样本数量,value = [0,2,1]代表三种种类的样本数量分别是多少。
一般来说,紫色越多的分支,分类效力越高。
如果要保存图片,可以使用下面的语句:
Image.open(BytesIO(graph.create_png())).save('roi.png')
如何选择最优路径的一些准则,笔者自己整理,勿怪:
- 紫色扎堆、链路较短、而且完整链路上只有紫色会更好;
- 链路最低端最好是gini = 0
4 高度可视化:dtree_viz
参考:非常fancy的可视化决策树dtree_viz
用dtreeviz实现决策树可视化
第一步:使用前需要安装
pip install dtreeviz
pip install pydotplus
第二步:然后安装:
如果要画出决策树图,一般需要该库,需要先下载:
http://www.graphviz.org/download/
第三步,使用的时候,需要键入:
import os
os.environ["PATH"] += os.pathsep + 'C:\\Desktop\\Graphviz\\bin\\'
import pydotplus
4.1 案例
import dtreeviz
import pandas as pd
import numpy as np
from sklearn.datasets import *
from sklearn import treeiris = load_iris()
df_iris = pd.DataFrame(iris['data'],columns = iris['feature_names'])
df_iris['target'] = iris['target']clf = tree.DecisionTreeClassifier()
clf.fit(iris.data,iris.target)import os
os.environ["PATH"] += os.pathsep + 'C:\\Graphviz\\bin\\'
import pydotplus from dtreeviz.trees import dtreeviz
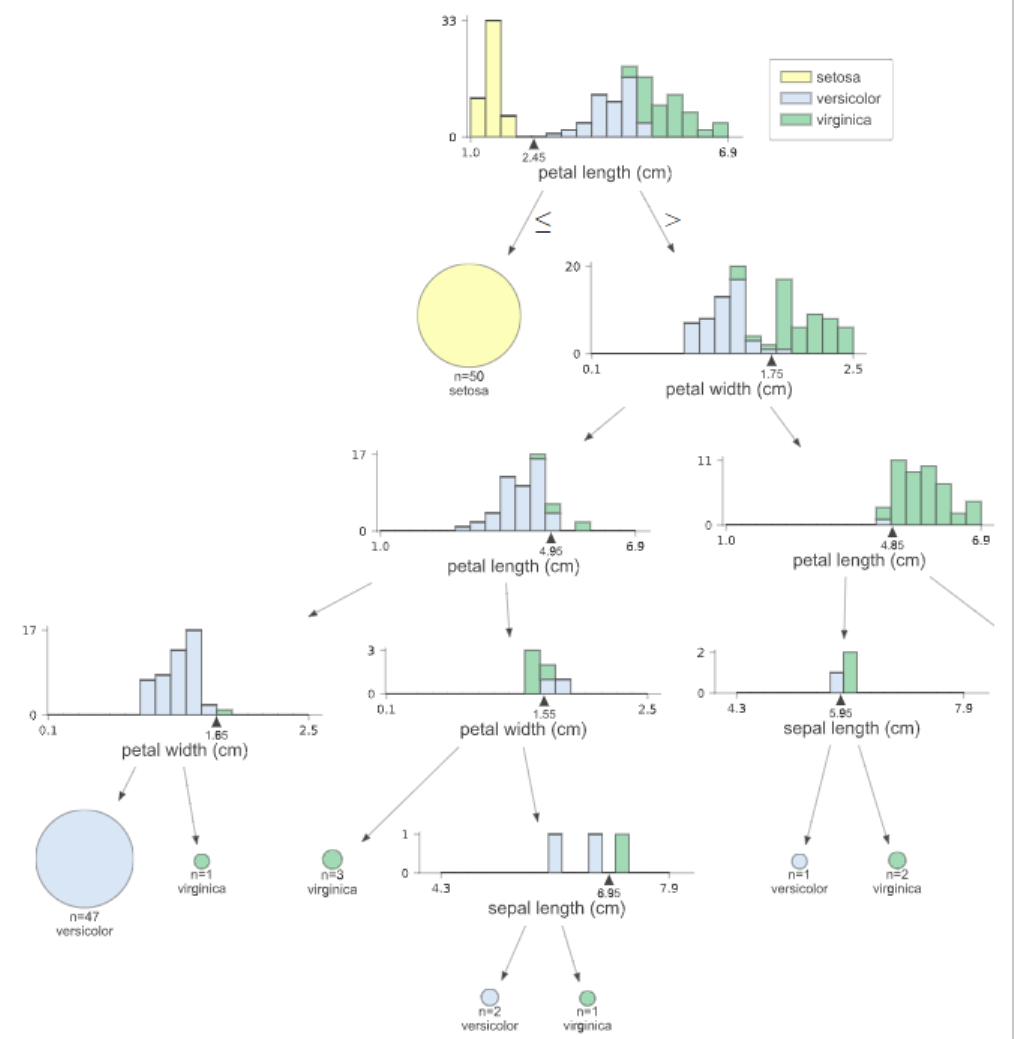
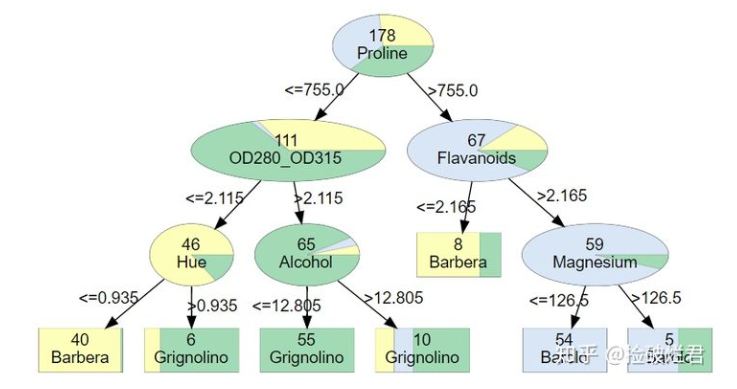
viz = dtreeviz(clf,iris['data'],iris['target'],target_name='',feature_names=np.array(iris['feature_names']),class_names={0:'setosa',1:'versicolor',2:'virginica'},scale=2)viz其中要想跑成功,这两句必不可少:
os.environ["PATH"] += os.pathsep + 'C:\\Graphviz\\bin\\'
import pydotplus
4.2 单样本分析
viz = dtreeviz(clf, x_data=X_train,y_data=y_train,target_name='class',feature_names=iris.feature_names, class_names=list(iris.target_names),title="Decision Tree - Iris data set",#orientation="LR", X=X_test[0])
viz
这张图与前一张非常相似,然而,橙色突出清楚地显示了样本所遵循的路径。此外,我们可以在每个直方图上看到橙色三角形。它表示给定特征的观察值。最后,我们看到了这个样本的所有特征的值,用于决策的特征用橙色突出显示。在这种情况下,只有两个特征被用来预测观察属于花色类。
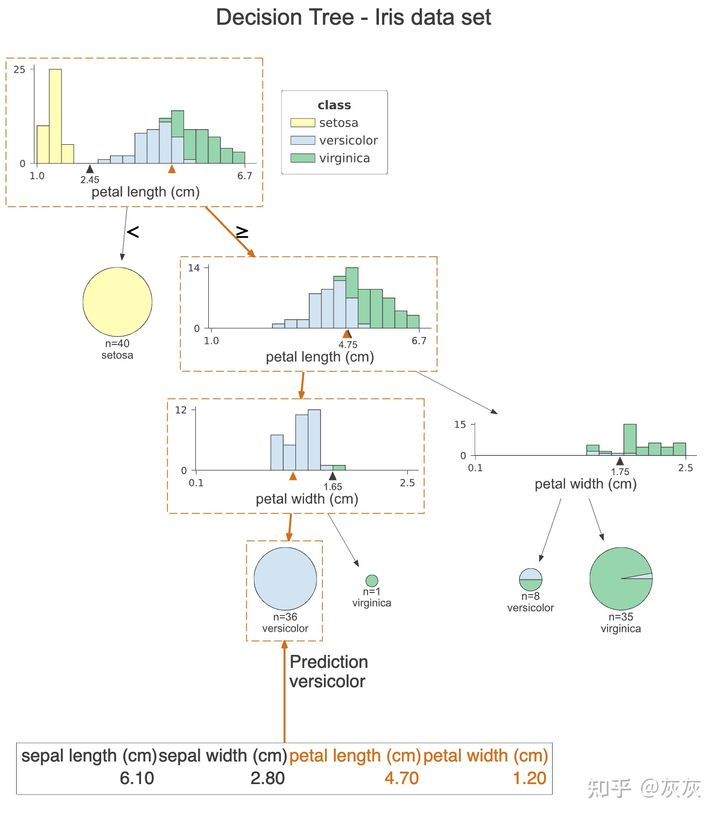
提示:我们还可以通过设置orientation=“LR”从上到下再从左到右更改绘图的方向。在本文中我们不展示它,因为对于屏幕较窄的设备,图表的缩放效果不会很好。
最后,我们可以用通俗易懂的英语打印这个观察预测所用的决定。为此运行以下命令
print(explain_prediction_path(clf, X_test[0], feature_names=iris.feature_names, explanation_type="plain_english"))# 2.45 <= petal length (cm)  < 4.75
# petal width (cm) < 1.65
这样我们就可以清楚地看到这个观察所满足的条件。
4.3 具有的参数
具体可以参考这个:https://github.com/parrt/dtreeviz/blob/master/dtreeviz/trees.py
可以看到:
def dtreeviz(tree_model,x_data: (pd.DataFrame, np.ndarray) = None,y_data: (pd.DataFrame, np.ndarray) = None,feature_names: List[str] = None,target_name: str = None,class_names: (Mapping[Number, str], List[str]) = None, # required if classifier,tree_index: int = None, # required in case of tree ensemble,precision: int = 2,orientation: ('TD', 'LR') = "TD",instance_orientation: ("TD", "LR") = "LR",show_root_edge_labels: bool = True,show_node_labels: bool = False,show_just_path: bool = False,fancy: bool = True,histtype: ('bar', 'barstacked', 'strip') = 'barstacked',highlight_path: List[int] = [],X: np.ndarray = None,max_X_features_LR: int = 10,max_X_features_TD: int = 20,depth_range_to_display: tuple = None,label_fontsize: int = 12,ticks_fontsize: int = 8,fontname: str = "Arial",title: str = None,title_fontsize: int = 14,colors: dict = None,cmap: str = "RdYlBu",scale=1.0) \-> DTreeViz:
可以调整的参数还是蛮多的
5 dtreeplot
来看一下一个DIY的库,还可以:Python必备!决策树可视化神器dtreeplot开源啦!
安装:
pip3 install dtreeplot
案例也比较简单:
# 使用
from dtreeplot import model_plotfrom sklearn import datasets
from sklearn.tree import DecisionTreeClassifier X, y = datasets.make_classification(n_samples=30000, n_features=10, weights=[0.96, 0.04], random_state=5)
features = [f'Var{i+1}' for i in range(X.shape[1])]clf = DecisionTreeClassifier(criterion='gini',max_depth=3, min_samples_split=30, min_samples_leaf=10, random_state=1234)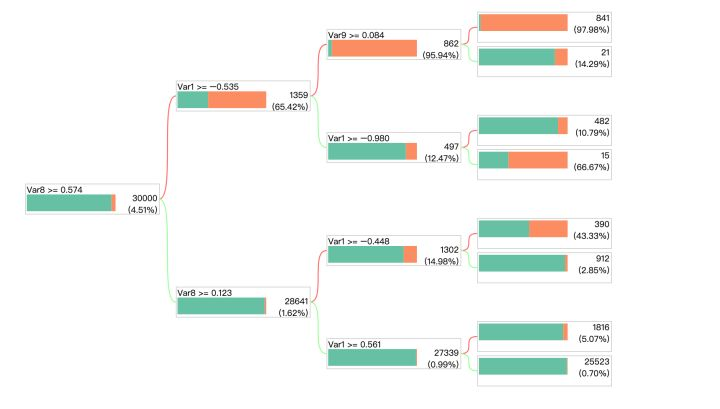
model = clf.fit(X, y)model_plot(model, features, labels=y, height=530)来看一下DecisionTreeClassifier其中的参数比较常见了:
- max_depth:树的深度
- min_samples_split:最小默认为2,最小分裂数
- min_samples_leaf:最小默认为1,一个叶子节点最少的样本数
案例二:
# import dtreeplot package model_plot function
from dtreeplot import model_plotfrom sklearn import datasets
from sklearn.tree import DecisionTreeClassifier iris = datasets.load_iris()
X = iris.data
y = iris.target
features = iris.feature_namesclf = DecisionTreeClassifier(max_depth=3, random_state=1234)
model = clf.fit(X, y)# visualize tree model
model_plot(model, features, labels=y, height=300)
当然,model_plot不太方便的是,生成的HTML是随机命名的,
一次性生成好几个可视化文件的,比较难找到。。
所以,可以自己DIY把model_plot中自动命名给改掉
6 scikit-learn + graphviz 自己DIY画图
整体来看,是作者DIY,所以可拓展性上确实要差一些
6.1 来源
来源文章:Python | 基于scikit-learn决策树可视化优化
github地址:tree.py
直接上代码好了,笔者非常简单的对原作者代码进行整理
原作者的数据源为:Titanic.csv
该代码因为是DIY的,需要安装graphviz,当然这个库,对于window用户来说,可以说是噩梦,可以参考之前的安装教程。
6.2 代码
import numpy as np
import pandas as pd
from sklearn.tree import DecisionTreeClassifier
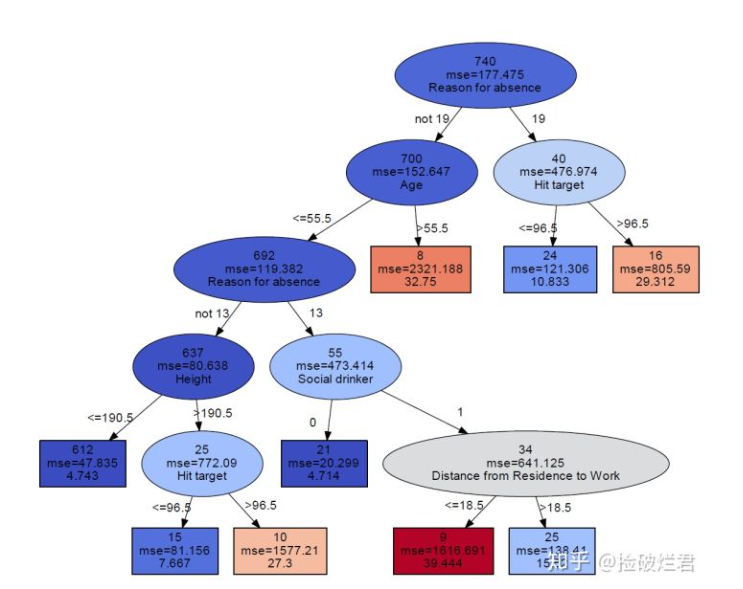
from sklearn.tree import DecisionTreeRegressor
import matplotlib.pyplot as plt
import matplotlib.cm as cm
from sklearn import tree
from sklearn.tree import _tree
from sklearn.base import is_classifier # 用于判断是回归树还是分类树
from dtreeviz.colors import adjust_colors # 用于分类树颜色(色盲友好模式)
import seaborn as sns #用于回归树颜色
from matplotlib.colors import Normalize # 用于标准化RGB数值
import graphviz # 插入graphviz库import os
os.environ["PATH"] += os.pathsep + 'Graphviz\\bin\\'
import pydotplusdef get_yvec_xmat_vnames(target, df):yvec = df[target]# 将拥有n个不同数值的变量转换为n个0/1的变量,变量名字中有"_isDummy_"作为标注xmat = pd.get_dummies(df.loc[:, df.columns != target], prefix_sep = "_isDummy_")vnames = xmat.columnsreturn yvec, xmat, vnamesdef get_categorical_dict(df):# store all the values of categorical valuedf_categorical = df.select_dtypes(include=['object', 'bool', 'category'])categorical_dict = {}for i in df_categorical.columns:# store in descending ordercategorical_dict[i]= sorted(list(set(df[i].astype('str'))))return categorical_dictdef tree_to_dot(tree, target, df):""" 把树变成dot data,用于输入graphviz然后绘制参数tree: DecisionTree的输出target: 目标变量名字df: 表单输出graphvic_str: dot data"""# get yvec, vnames and categorical_dict of the dfyvec, xmat, vnames = get_yvec_xmat_vnames(target, df)categorical_dict = get_categorical_dict(df)if is_classifier(tree):# 如果是分类树# classes should be in descending orderclass_names = sorted(list(set(yvec)))return classification_tree_to_dot(tree, vnames, class_names, categorical_dict)else:return regression_tree_to_dot(tree, vnames, categorical_dict)def classification_tree_to_dot(tree, feature_names, class_names, categorical_dict):""" 把分类树转化成dot data参数tree: DecisionTreeClassifier的输出feature_names: vnames, 除去目标变量所有变量的名字class_names: 目标变量所有的分类categorical_dict: 储存所有名称及分类的字典输出graphvic_str: the dot data""" tree_ = tree.tree_# store colors that distinguish discrete chunks of dataif len(class_names) <= 10:# get the colorblind friendly colorscolor_palette = adjust_colors(None)['classes'][len(class_names)]else:color_palette = sns.color_palette("coolwarm",len(class_names)).as_hex()feature_name = [feature_names[i] if i != _tree.TREE_UNDEFINED else "undefined!"for i in tree_.feature]# initialize the dot data stringgraphvic_str = 'digraph Tree {node [shape=oval, penwidth=0.1, width=1, fontname=helvetica] ; edge [fontname=helvetica] ;'#print(graphvic_str)# node = 0# depth = 1def recurse(node, depth, categorical_dict):# store the categorical_dict information of each sidecategorical_dict_L = categorical_dict.copy()categorical_dict_R = categorical_dict.copy()# non local statement of graphvic_strnonlocal graphvic_str# variable is not dummy by defaultis_dummy = False# get the thresholdthreshold = tree_.threshold[node]# get the feature namename = feature_name[node]# judge whether a feature is dummy or not by the indicator "_isDummy_"if "_isDummy_" in str(name) and name.split('_isDummy_')[0] in list(categorical_dict.keys()):is_dummy = True# if the feature is dummy, the threshold is the value following namename, threshold = name.split('_isDummy_')[0], name.split('_isDummy_')[1]# get the data distribution of current nodevalue = tree_.value[node][0]# get the total amountn_samples = tree_.n_node_samples[node]# calculate the weightweights = [i/sum(value) for i in value]# get the largest classclass_name = class_names[np.argmax(value)]# pair the color and weightfillcolor_str = ""for i, j in enumerate(color_palette): fillcolor_str += j + ";" + str(weights[i]) + ":"fillcolor_str = '"' + fillcolor_str[:-1] + '"'if tree_.feature[node] != _tree.TREE_UNDEFINED: # if the node is not a leafgraphvic_str += ('{} [style=wedged, label=<{}<br/>{}>, fillcolor ='+fillcolor_str+'] ;').format(node,n_samples,name)#print(('{} [style=wedged, label=<{}<br/>{}>, fillcolor ='+fillcolor_str+'] ;').format(node,n_samples,name))if is_dummy:# if the feature is dummy and if its total categories > 5categorical_dict_L[name] = [str(i) for i in categorical_dict_L[name] if i != threshold]categorical_dict_R[name] = [str(threshold)]if len(categorical_dict[name])>5:# only show one category on edgethreshold_left = "not " + thresholdthreshold_right = thresholdelse:# if total categories <= 5, list all the categories on edgethreshold_left = ", ".join( categorical_dict_L[name])threshold_right = thresholdelse:# if the feature is not dummy, then it is numericalthreshold_left = "<="+ str(round(threshold,3))threshold_right = ">"+ str(round(threshold,3))graphvic_str += ('{} -> {} [labeldistance=2.5, labelangle=45, headlabel="{}"] ;').format(node,tree_.children_left[node],threshold_left)graphvic_str += ('{} -> {} [labeldistance=2.5, labelangle=-45, headlabel="{}"] ;').format(node,tree_.children_right[node],threshold_right)#print(('{} -> {} [labeldistance=2.5, labelangle=45, headlabel="{}"] ;').format(node,tree_.children_left[node],threshold_left))#print(('{} -> {} [labeldistance=2.5, labelangle=-45, headlabel="{}"] ;').format(node,tree_.children_right[node],threshold_right))recurse(tree_.children_left[node], depth + 1,categorical_dict_L)recurse(tree_.children_right[node], depth + 1,categorical_dict_R)else:# the node is a leafgraphvic_str += ('{} [shape=box, style=striped, label=<{}<br/>{}>, fillcolor ='+fillcolor_str+'] ;').format(node,n_samples,class_name)#print(('{} [shape=box, style=striped, label=<{}<br/>{}>, fillcolor ='+fillcolor_str+'] ;').format(node,n_samples,class_name))recurse(0, 1,categorical_dict)return graphvic_str + "}"def regression_tree_to_dot(tree, feature_names, categorical_dict):""" 把回归树转换成dot data参数tree: DecisionTreeClassifier的输出feature_names: vnames, 除去目标变量所有变量的名字categorical_dict: 储存所有名称及分类的字典输出graphvic_str: the dot data""" # get the criterion of regression tree: mse or maecriterion = tree.get_params()['criterion']tree_ = tree.tree_value_list = tree_.value[:,0][:,0]# Normalize data to produce heatmap colorscmap = cm.get_cmap('coolwarm')norm = Normalize(vmin=min(value_list), vmax=max(value_list))rgb_values = (cmap(norm(value_list))*255).astype(int)hex_values = ['#%02x%02x%02x' % (i[0], i[1], i[2]) for i in rgb_values]feature_name = [feature_names[i] if i != _tree.TREE_UNDEFINED else "undefined!"for i in tree_.feature]# initialize the dot data stringgraphvic_str = 'digraph Tree {node [shape=oval, width=1, color="black", fontname=helvetica] ;edge [fontname=helvetica] ;'#print(graphvic_str)def recurse(node, depth, categorical_dict):# store the categorical_dict information of each sidecategorical_dict_L = categorical_dict.copy()categorical_dict_R = categorical_dict.copy()# non local statement of graphvic_strnonlocal graphvic_str# variable is not dummy by defaultis_dummy = False# get the thresholdthreshold = tree_.threshold[node]# get the feature namename = feature_name[node]# judge whether a feature is dummy or not by the indicator "_isDummy_"if "_isDummy_" in str(name) and name.split('_isDummy_')[0] in list(categorical_dict.keys()):is_dummy = True# if the feature is dummy, the threshold is the value following namename, threshold = name.split('_isDummy_')[0], name.split('_isDummy_')[1]# get the regression valuevalue = round(tree_.value[node][0][0],3)# get the impurityimpurity = criterion+ "=" + str(round(tree_.impurity[node],3))# get the total amountn_samples = tree_.n_node_samples[node]# pair the color with nodefillcolor_str = '"'+hex_values[node]+'"'if tree_.feature[node] != _tree.TREE_UNDEFINED: # if the node is not a leafgraphvic_str += ('{} [style="filled", label=<{}<br/>{}<br/>{}>, fillcolor ='+fillcolor_str+'] ;').format(node,n_samples,impurity,name)#print(('{} [style="filled", label=<{}<br/>{}<br/>{}>, fillcolor ='+fillcolor_str+'] ;').format(node,n_samples,impurity,name))if is_dummy:# if the feature is dummy and if its total categories > 5categorical_dict_L[name] = [str(i) for i in categorical_dict_L[name] if i != threshold]categorical_dict_R[name] = [str(threshold)]if len(categorical_dict[name])>5:# only show one category on edgethreshold_left = "not " + thresholdthreshold_right = thresholdelse:# if total categories <= 5, list all the categories on edgethreshold_left = ", ".join(categorical_dict_L[name])threshold_right = thresholdelse:# if the feature is not dummy, then it is numericalthreshold_left = "<="+ str(round(threshold,3))threshold_right = ">"+ str(round(threshold,3))graphvic_str += ('{} -> {} [labeldistance=2.5, labelangle=45, headlabel="{}"] ;').format(node,tree_.children_left[node],threshold_left)graphvic_str += ('{} -> {} [labeldistance=2.5, labelangle=-45, headlabel="{}"] ;').format(node,tree_.children_right[node],threshold_right)#print(('{} -> {} [labeldistance=2.5, labelangle=45, headlabel="{}"] ;').format(node,tree_.children_left[node],threshold_left))#print(('{} -> {} [labeldistance=2.5, labelangle=-45, headlabel="{}"] ;').format(node,tree_.children_right[node],threshold_right))recurse(tree_.children_left[node], depth + 1,categorical_dict_L)recurse(tree_.children_right[node], depth + 1,categorical_dict_R)else:# the node is a leafgraphvic_str += ('{} [shape=box, style=filled, label=<{}<br/>{}<br/>{}>, fillcolor ='+fillcolor_str+'] ;').format(node,n_samples,impurity,value)#print(('{} [shape=box, style=filled, label=<{}<br/>{}<br/>{}>, fillcolor ='+fillcolor_str+'] ;').format(node,n_samples,impurity,value))recurse(0, 1,categorical_dict)return graphvic_str + "}"if __name__=='__main__':df = pd.read_csv('Titanic.csv', header=0)df.dtypesdf.survived = df.survived.astype(str)yvec, xmat, vnames = get_yvec_xmat_vnames("survived",df)dt = DecisionTreeClassifier(max_depth=2, random_state=1234)dt.fit(xmat, yvec)dot_data = tree.export_graphviz(dt,feature_names = vnames, filled=True) graph = graphviz.Source(dot_data) graph dot_data = tree_to_dot(dt, "survived",df)graph = graphviz.Source(dot_data) graph效果为:
当然这里没有提到如何保存图片,可以参考:
graph.render(filename='test2',view = True, format='jpg')
简单说一下原理,就是:
- 先生成丑的树
- 提取信息 + 加工,生成上述的树
抽取信息 + 重组信息为以下格式:
Out[45]: 'digraph Tree {node [shape=oval, penwidth=0.1, width=1, fontname=helvetica] ; edge [fontname=helvetica] ;0 [style=wedged, label=<100<br/>FT_PurchaseFrist_category_SC>, fillcolor ="#FEFEBB;0.95:#a1dab4;0.05"] ;0 -> 1 [labeldistance=2.5, labelangle=45, headlabel="<=0.5"] ;0 -> 6 [labeldistance=2.5, labelangle=-45, headlabel=">0.5"] ;1 [style=wedged, label=<84<br/>FT_Purchase_line_Prestige_White>, fillcolor ="#FEFEBB;0.9880952380952381:#a1dab4;0.011904761904761904"] ;1 -> 2 [labeldistance=2.5, labelangle=45, headlabel="<=0.5"] ;1 -> 3 [labeldistance=2.5, labelangle=-45, headlabel=">0.5"] ;2 [shape=box, style=striped, label=<81<br/>0>, fillcolor ="#FEFEBB;1.0:#a1dab4;0.0"] ;3 [style=wedged, label=<3<br/>FT_FirstYear_c>, fillcolor ="#FEFEBB;0.6666666666666666:#a1dab4;0.3333333333333333"] ;3 -> 4 [labeldistance=2.5, labelangle=45, headlabel="<=0.5"] ;3 -> 5 [labeldistance=2.5, labelangle=-45, headlabel=">0.5"] ;4 [shape=box, style=striped, label=<1<br/>1>, fillcolor ="#FEFEBB;0.0:#a1dab4;1.0"] ;5 [shape=box, style=striped, label=<2<br/>0>, fillcolor ="#FEFEBB;1.0:#a1dab4;0.0"] ;6 [style=wedged, label=<16<br/>FT_PurchaseFrist_line_Capture_Totale>, fillcolor ="#FEFEBB;0.75:#a1dab4;0.25"] ;6 -> 7 [labeldistance=2.5, labelangle=45, headlabel="<=0.5"] ;6 -> 16 [labeldistance=2.5, labelangle=-45, headlabel=">0.5"] ;7 [style=wedged, label=<10<br/>FT_PurchaseCross_category_SCMUFR>, fillcolor ="#FEFEBB;0.6:#a1dab4;0.4"] ;7 -> 8 [labeldistance=2.5, labelangle=45, headlabel="<=0.5"] ;7 -> 15 [labeldistance=2.5, labelangle=-45, headlabel=">0.5"] ;8 [style=wedged, label=<7<br/>FT_Purchase_line_MU_other>, fillcolor ="#FEFEBB;0.42857142857142855:#a1dab4;0.5714285714285714"] ;8 -> 9 [labeldistance=2.5, labelangle=45, headlabel="<=0.5"] ;8 -> 14 [labeldistance=2.5, labelangle=-45, headlabel=">0.5"] ;9 [style=wedged, label=<5<br/>FT_PurchaseCross_category_SCMU>, fillcolor ="#FEFEBB;0.6:#a1dab4;0.4"] ;9 -> 10 [labeldistance=2.5, labelangle=45, headlabel="<=0.5"] ;9 -> 13 [labeldistance=2.5, labelangle=-45, headlabel=">0.5"] ;10 [style=wedged, label=<3<br/>FT_PurchaseFrist_line_Life>, fillcolor ="#FEFEBB;0.3333333333333333:#a1dab4;0.6666666666666666"] ;10 -> 11 [labeldistance=2.5, labelangle=45, headlabel="<=0.5"] ;10 -> 12 [labeldistance=2.5, labelangle=-45, headlabel=">0.5"] ;11 [shape=box, style=striped, label=<2<br/>1>, fillcolor ="#FEFEBB;0.0:#a1dab4;1.0"] ;12 [shape=box, style=striped, label=<1<br/>0>, fillcolor ="#FEFEBB;1.0:#a1dab4;0.0"] ;13 [shape=box, style=striped, label=<2<br/>0>, fillcolor ="#FEFEBB;1.0:#a1dab4;0.0"] ;14 [shape=box, style=striped, label=<2<br/>1>, fillcolor ="#FEFEBB;0.0:#a1dab4;1.0"] ;15 [shape=box, style=striped, label=<3<br/>0>, fillcolor ="#FEFEBB;1.0:#a1dab4;0.0"] ;16 [shape=box, style=striped, label=<6<br/>0>, fillcolor ="#FEFEBB;1.0:#a1dab4;0.0"] ;}'
这篇关于决策树以及XGBoost 树分裂图的多种可视化工具盘点的文章就介绍到这儿,希望我们推荐的文章对编程师们有所帮助!


