本文主要是介绍Qt利用paintEvent绘制双Y轴坐标折线图,希望对大家解决编程问题提供一定的参考价值,需要的开发者们随着小编来一起学习吧!
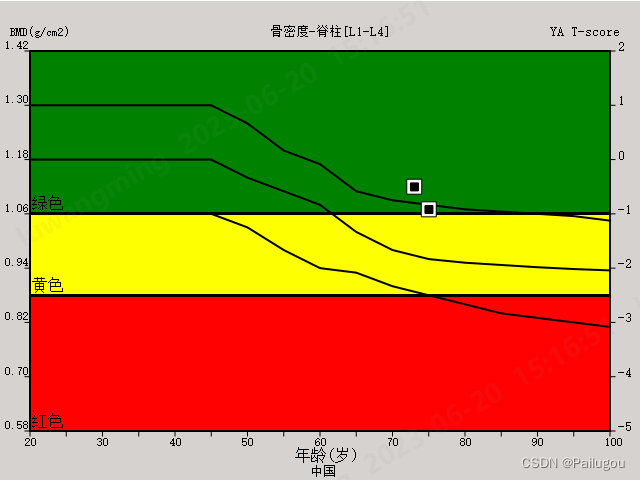
在项目中,根据需求需要开发双Y轴坐标折线图,但是由于它有多个图层,如果使用QChart绘制的话,达不到需求的要求,只能自己绘制,具体的利用translate()接口将坐标系统移动到界面的左下角(30, height() - 50)处,这样向上就是-y,向下+y,数据映射到坐标系上面更加的方便,具体实现如下:#pragma once
#include <qwidget.h>
#include <QPainter>
#include <QPaintEvent>
#include <iostream>
class DrawBoneArg : public QWidget
{Q_OBJECT
public://tuple元素前两个是左Y轴最大最小值,中间两个是右Y轴最大最小值,最后两个是x轴最大最小值,   其他三个参数分别是轴的偏移量(每个间隔多少值)explicit DrawBoneArg(std::tuple<double, double, double, double, double, double > AxisMaxMinValue = { 0.58,1.42,-5,2,20,100 }, double leftYAxisOffset = 0.12, double rightYAxisOffset = 1, int xAxisOffset = 5, QWidget* parent = nullptr);//从数据库中读出的标准数据void setStandardData(std::vector<std::map<unsigned int, double> > standardData);//绘制区域的最大最小值(对应的左Y轴值),颜色,字体void setRegionMaxMinColorTextValue(std::vector<std::tuple<double, double, QColor, std::string> > RegionData);void setInspectResult(unsigned int age, const double boneValue);void setInspectResult(std::vector<std::pair<unsigned int, double> > re);
private:void drawBackGround(QPainter& painter);void drawAxis(QPainter& painter);void drawRegion(QPainter& painter);void drawValueLine(QPainter& painter);void drawInspectResult(QPainter& painter);void initWin();
protected:void paintEvent(QPaintEvent* pEvent);private://坐标轴上刻度跟刻度之间的距离float m_yLeftAxisCoefficient;float m_yRightAxisCoefficient;float m_xAgeAxisCoefficient;//绘制折线标准数据第一个是年龄,第二个是标准版骨密度值std::vector<std::map<unsigned int, double> > m_boneStandardData;//前两个元素左Y轴最小最大值, 中间两个元素右Y轴最小最大值, 最后两个X轴最小最大值std::tuple<double, double, double, double, double, double> m_dAxisMaxMinValue;std::vector<std::tuple<double, double, QColor, std::string> >  m_regionData;//x轴偏移量int m_iAgeOffset;//左Y轴偏移量double m_dLeftYAxisOffset;//右Y轴偏移量double m_dRightYAxisOffset;//当前检查者检查结果std::vector<std::pair<unsigned int, const double> > m_InspectResult;
};
#include "DrawBoneArg.h"DrawBoneArg::DrawBoneArg(std::tuple<double, double, double, double, double, double> AxisMaxMinValue, double leftYAxisOffset, double rightYAxisOffset, int xAxisOffset, QWidget* parent): QWidget(parent), m_dAxisMaxMinValue(AxisMaxMinValue), m_iAgeOffset(xAxisOffset), m_dLeftYAxisOffset(leftYAxisOffset), m_dRightYAxisOffset(rightYAxisOffset)
{this->initWin();}void DrawBoneArg::initWin()
{std::map<unsigned int, double> map1;map1.insert(std::pair<unsigned int, double>(20, 1.06));map1.insert(std::pair<unsigned int, double>(25, 1.06));map1.insert(std::pair<unsigned int, double>(30, 1.06));map1.insert(std::pair<unsigned int, double>(35, 1.06));map1.insert(std::pair<unsigned int, double>(40, 1.06));map1.insert(std::pair<unsigned int, double>(45, 1.06));map1.insert(std::pair<unsigned int, double>(50, 1.03));map1.insert(std::pair<unsigned int, double>(55, 0.98));map1.insert(std::pair<unsigned int, double>(60, 0.94));map1.insert(std::pair<unsigned int, double>(65, 0.93));map1.insert(std::pair<unsigned int, double>(70, 0.90));map1.insert(std::pair<unsigned int, double>(75, 0.88));map1.insert(std::pair<unsigned int, double>(80, 0.86));map1.insert(std::pair<unsigned int, double>(85, 0.84));map1.insert(std::pair<unsigned int, double>(90, 0.83));map1.insert(std::pair<unsigned int, double>(95, 0.82));map1.insert(std::pair<unsigned int, double>(100, 0.81));this->m_boneStandardData.emplace_back(map1);map1.clear();map1.insert(std::pair<unsigned int, double>(20, 1.18));map1.insert(std::pair<unsigned int, double>(25, 1.18));map1.insert(std::pair<unsigned int, double>(30, 1.18));map1.insert(std::pair<unsigned int, double>(35, 1.18));map1.insert(std::pair<unsigned int, double>(40, 1.18));map1.insert(std::pair<unsigned int, double>(45, 1.18));map1.insert(std::pair<unsigned int, double>(50, 1.14));map1.insert(std::pair<unsigned int, double>(55, 1.11));map1.insert(std::pair<unsigned int, double>(60, 1.08));map1.insert(std::pair<unsigned int, double>(65, 1.02));map1.insert(std::pair<unsigned int, double>(70, 0.98));map1.insert(std::pair<unsigned int, double>(75, 0.96));map1.insert(std::pair<unsigned int, double>(80, 0.952));map1.insert(std::pair<unsigned int, double>(85, 0.947));map1.insert(std::pair<unsigned int, double>(90, 0.942));map1.insert(std::pair<unsigned int, double>(95, 0.938));map1.insert(std::pair<unsigned int, double>(100, 0.935));this->m_boneStandardData.emplace_back(map1);map1.clear();map1.insert(std::pair<unsigned int, double>(20, 1.30));map1.insert(std::pair<unsigned int, double>(25, 1.30));map1.insert(std::pair<unsigned int, double>(30, 1.30));map1.insert(std::pair<unsigned int, double>(35, 1.30));map1.insert(std::pair<unsigned int, double>(40, 1.30));map1.insert(std::pair<unsigned int, double>(45, 1.30));map1.insert(std::pair<unsigned int, double>(50, 1.26));map1.insert(std::pair<unsigned int, double>(55, 1.20));map1.insert(std::pair<unsigned int, double>(60, 1.17));map1.insert(std::pair<unsigned int, double>(65, 1.11));map1.insert(std::pair<unsigned int, double>(70, 1.09));map1.insert(std::pair<unsigned int, double>(75, 1.08));map1.insert(std::pair<unsigned int, double>(80, 1.07));map1.insert(std::pair<unsigned int, double>(85, 1.065));map1.insert(std::pair<unsigned int, double>(90, 1.06));map1.insert(std::pair<unsigned int, double>(95, 1.055));map1.insert(std::pair<unsigned int, double>(100, 1.045));this->m_boneStandardData.emplace_back(map1);std::tuple<double, double, QColor, std::string> tup1(0.58, 0.88, QColor(255,1,0), "红色");std::tuple<double, double, QColor, std::string> tup2(0.88, 1.06, QColor(254,255,0), "黄色");std::tuple<double, double, QColor, std::string> tup3(1.06, 1.42, QColor(0, 130, 0), "绿色");m_regionData.emplace_back(tup1);m_regionData.emplace_back(tup2);m_regionData.emplace_back(tup3);//this->setInspectResult(70, 1.06);std::pair<unsigned int, double> pa{ 75, 1.07 };std::pair<unsigned int, double> pa1{ 73, 1.12 };std::vector<std::pair<unsigned int, double> > vec;vec.push_back(pa);vec.push_back(pa1);setInspectResult(vec);
}void DrawBoneArg::setStandardData(std::vector<std::map<unsigned int, double> > standardData)
{m_boneStandardData = standardData;this->update();
}void DrawBoneArg::setRegionMaxMinColorTextValue(std::vector<std::tuple<double, double, QColor, std::string> > data)
{m_regionData = data;
}void DrawBoneArg::setInspectResult(unsigned int age, const double boneValue)
{m_InspectResult.clear();std::pair<unsigned int, const double> re = std::make_pair(age, boneValue);m_InspectResult.emplace_back(re);this->update();
}void DrawBoneArg::setInspectResult(std::vector<std::pair<unsigned int, double> > re)
{if (re.empty())return;m_InspectResult.clear();auto it = re.begin();while (it != re.end()){m_InspectResult.emplace_back(*it);++it;}this->update();
}void DrawBoneArg::paintEvent(QPaintEvent* pEvent)
{QPainter painter(this);painter.setRenderHint(QPainter::Antialiasing, true);this->drawBackGround(painter);this->drawAxis(painter);this->drawRegion(painter);this->drawValueLine(painter);this->drawInspectResult(painter);QWidget::paintEvent(pEvent);
}void DrawBoneArg::drawBackGround(QPainter& painter)
{painter.setPen(Qt::NoPen);painter.setBrush(QColor(214,210,207));painter.drawRect(rect());
}void DrawBoneArg::drawAxis(QPainter& painter)
{//将坐标系移动到界面左下角(30, this->height()_50)处painter.translate(30, this->height() - 50);painter.setPen(QPen(Qt::black));painter.drawLine(QPointF(0, 0), QPointF(0, -this->height() + 100));//左竖线QPointF yRe = QPointF(0, -this->height() + 100) - QPointF(0, 0);int leftYNum = (std::get<1>(this->m_dAxisMaxMinValue) - std::get<0>(this->m_dAxisMaxMinValue)) / this->m_dLeftYAxisOffset;float coefficient = yRe.y() / leftYNum;m_yLeftAxisCoefficient = coefficient;float y = 0;float v = std::get<0>(m_dAxisMaxMinValue);for (int i = 0; i <= leftYNum; i++){painter.drawLine(QPointF(0, y), QPointF(-5, y));painter.drawText(QPointF(-25, y-2), QString::number(v, 'f', 2));v += m_dLeftYAxisOffset;y += coefficient;}QFont font;font.setPointSizeF(12);painter.drawText(QPointF(-20, -this->height() + 85), "BMD(g/cm2)");//QString::fromUtf8("2\u00B2")painter.drawLine(QPointF(0, 0), QPointF(this->width() - 60, 0));//底横线QPointF re = QPointF(this->width() - 60, 0) - QPointF(0, 0);int xAixsNum = (std::get<5>(this->m_dAxisMaxMinValue) - std::get<4>(m_dAxisMaxMinValue)) / this->m_iAgeOffset;float coefficientX = re.x() / xAixsNum;m_xAgeAxisCoefficient = coefficientX;float x = 0;int age = std::get<4>(this->m_dAxisMaxMinValue);for (int i = 0; i <= xAixsNum; i++){painter.drawLine(QPointF(x, 0), QPointF(x, 5));if (i % 2 == 0)painter.drawText(QPointF(x - 5, 15), QString::number(age));x += coefficientX;age += m_iAgeOffset;}font.setPointSizeF(12);painter.setFont(font);painter.drawText(re.x() / 2 - 25, 30, QStringLiteral("年龄(岁)"));font.setPointSize(10);painter.setFont(font);painter.drawText(re.x() / 2 - 10, 45, QStringLiteral("中国"));painter.drawLine(QPointF(0, -this->height() + 100), QPointF(this->width() - 60, -this->height() + 100));//上横线QPointF xTop = QPointF(this->width() - 60, -this->height() + 100) - QPointF(0, -this->height() + 100);float textX = xTop.x() / 2 - 50;font.setPointSizeF(15);painter.drawText(textX, -this->height() + 85, QStringLiteral("骨密度-脊柱[L1-L4]"));painter.drawLine(QPointF(this->width() - 60, -this->height() + 100), QPointF(this->width() - 60, 0));//右竖线QPointF yRightRe = QPointF(this->width() - 60, -this->height() + 100) - QPointF(this->width() - 60, 0);int rightYAxis = (std::get<3>(this->m_dAxisMaxMinValue) - std::get<2>(this->m_dAxisMaxMinValue)) / m_dRightYAxisOffset;float coefficientYRight = yRightRe.y() / rightYAxis;m_yRightAxisCoefficient = coefficientYRight;float yRight = 0;float vy = std::get<2>(this->m_dAxisMaxMinValue);for (int i = 0; i <= rightYAxis; i++){painter.drawLine(QPointF(this->width() - 60, yRight), QPointF(this->width() - 55, yRight));painter.drawText(QPointF(this->width() - 52, yRight), QString::number(vy));vy += m_dRightYAxisOffset;yRight += coefficientYRight;}font.setPointSizeF(10);painter.drawText(QPointF(this->width() - 120, -this->height() + 85), QString("YA T-score"));
}void DrawBoneArg::drawRegion(QPainter& painter)
{QPen pen(Qt::black);pen.setWidth(2);painter.setPen(pen);auto it = this->m_regionData.begin();while (it != this->m_regionData.end()){float yAxisValue = ((std::get<1>(*it) - std::get<0>(m_dAxisMaxMinValue)) / m_dLeftYAxisOffset) * m_yLeftAxisCoefficient;float height = ((std::get<1>(*it) - std::get<0>(*it)) / m_dLeftYAxisOffset) * m_yLeftAxisCoefficient;QBrush brush(std::get<2>(*it));painter.setBrush(brush);painter.drawRect(0, yAxisValue, this->width() - 60, -height);QFont font;font.setPointSizeF(12);painter.setFont(font);painter.drawText(2, yAxisValue - 2, this->width() - 60, -height, Qt::AlignLeft | Qt::AlignBottom, QString::fromLocal8Bit(std::get<3>(*it).c_str()));++it;}
}void DrawBoneArg::drawValueLine(QPainter& painter)
{QPen pen(Qt::black);pen.setWidth(2);painter.setPen(pen);auto it = this->m_boneStandardData.begin();while (it != this->m_boneStandardData.end()){auto mapIt = it->begin();QPolygonF poly;while (mapIt != it->end()){double x = ((mapIt->first - std::get<4>(m_dAxisMaxMinValue)) / m_iAgeOffset) * m_xAgeAxisCoefficient;double y = ((mapIt->second - std::get<0>(m_dAxisMaxMinValue)) / m_dLeftYAxisOffset) * m_yLeftAxisCoefficient;poly << QPointF(x, y);++mapIt;}painter.drawPolyline(poly);++it;}
}void DrawBoneArg::drawInspectResult(QPainter& painter)
{if (m_InspectResult.empty())return;auto it = m_InspectResult.begin();QPen pen(Qt::black);pen.setWidth(1);painter.setPen(pen);while (it != m_InspectResult.end()){double x = ((it->first - std::get<4>(m_dAxisMaxMinValue)) / m_iAgeOffset)* m_xAgeAxisCoefficient;double y = ((it->second - std::get<0>(m_dAxisMaxMinValue)) / m_dLeftYAxisOffset) * m_yLeftAxisCoefficient;QBrush br(Qt::white);painter.setBrush(br);painter.drawRect( QRectF(x-7.5, y-7.5, 15, 15));br.setColor(QColor(0, 0, 0));painter.setBrush(br);painter.drawRect(QRectF(x - 3.8, y - 3.8, 8, 8));++it;}
}
这篇关于Qt利用paintEvent绘制双Y轴坐标折线图的文章就介绍到这儿,希望我们推荐的文章对编程师们有所帮助!


