本文主要是介绍echarts的柱状图的重叠和堆叠实现两个柱体的显示和之前的差值显示,希望对大家解决编程问题提供一定的参考价值,需要的开发者们随着小编来一起学习吧!
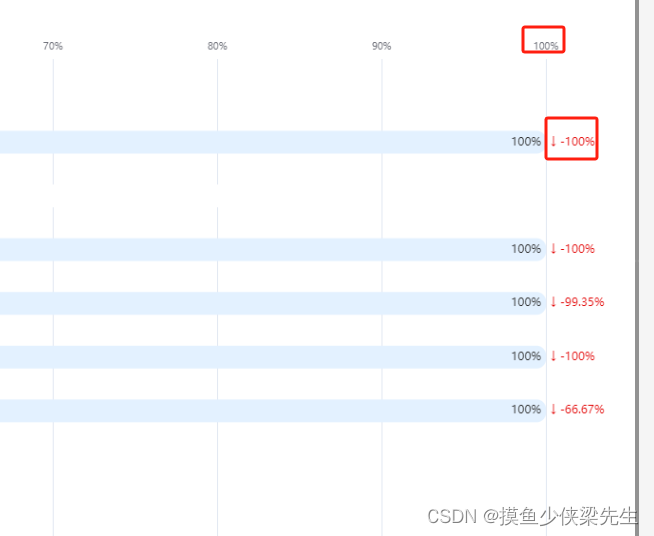
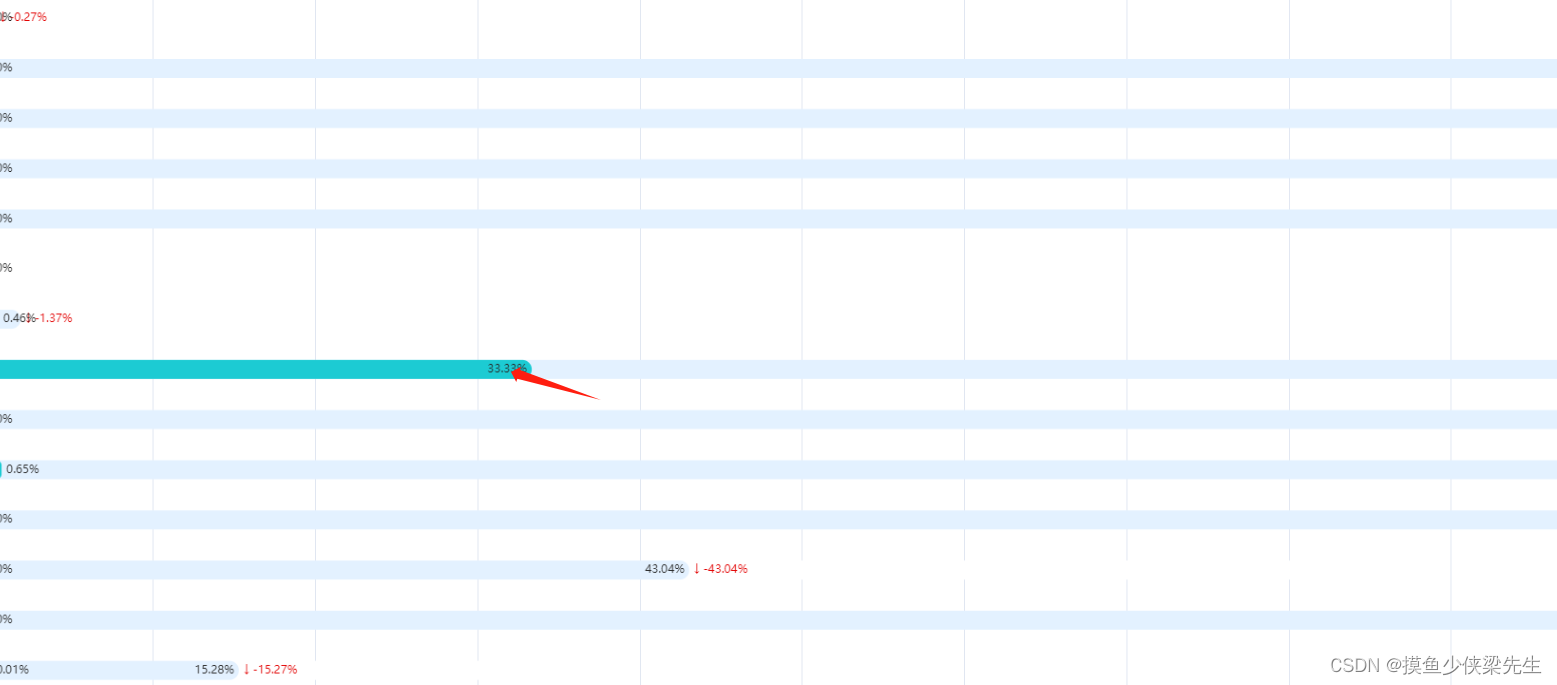
效果图
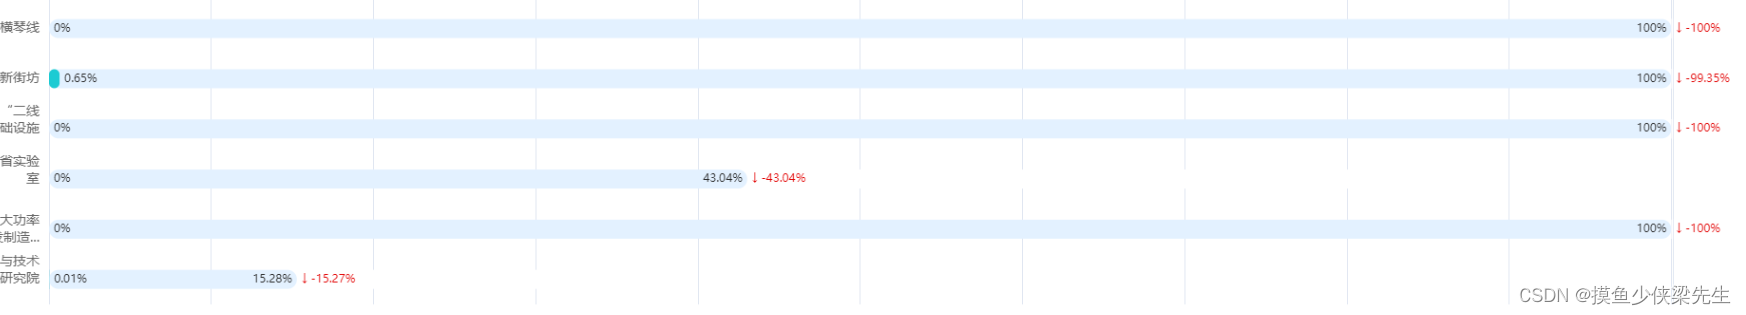
主要思路
准备三个柱体(原计划,实际进度,差值)
原计划和实际进度设置成重叠
{barWidth: 20,// yAxisIndex: 1,z: 1,name: '原计划',type: 'bar',stack: 'ab',emphasis: { // 点击柱体其他柱体颜色会变浅disabled: true},label: {show: true},itemStyle: {emphasis: {barBorderRadius: 10},normal: {barBorderRadius: 10}},data: this.planProcessData.map((item) => {return {value: item,label: {show: !(item < 10),formatter: item + '%',position: 'insideRight',textStyle: {color: '#262626',fontSize: 12}}}})},
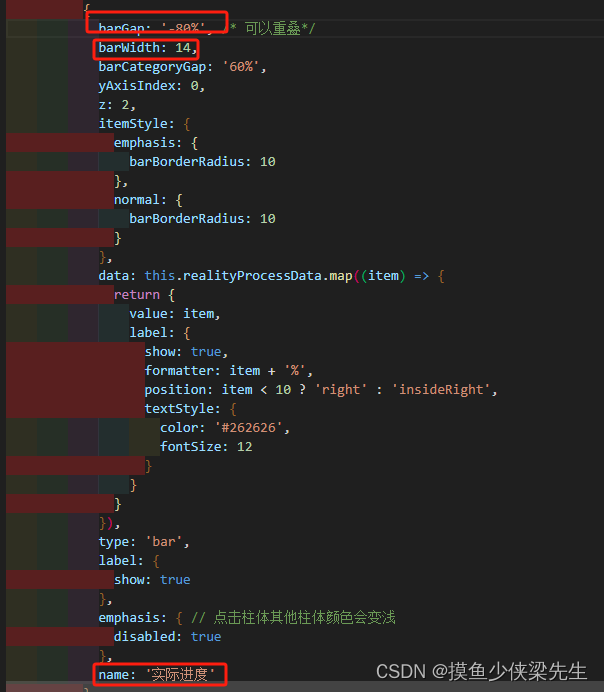
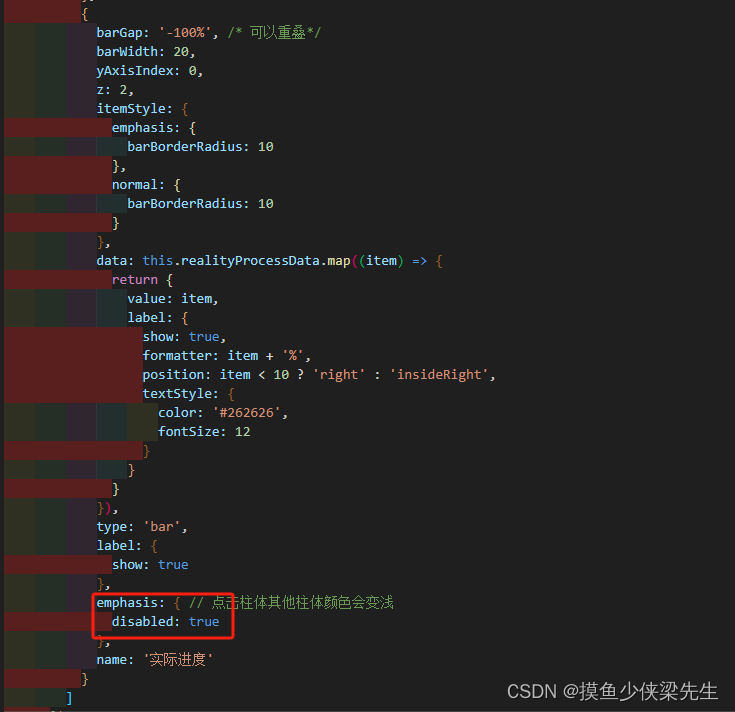
{barGap: '-100%', /* 可以重叠*/barWidth: 20,yAxisIndex: 0,z: 2,itemStyle: {emphasis: {barBorderRadius: 10},normal: {barBorderRadius: 10}},data: this.realityProcessData.map((item) => {return {value: item,label: {show: true,formatter: item + '%',position: item < 10 ? 'right' : 'insideRight',textStyle: {color: '#262626',fontSize: 12}}}}),type: 'bar',label: {show: true},emphasis: { // 点击柱体其他柱体颜色会变浅disabled: true},name: '实际进度'}
将实际进度的 barGap: ‘-100%’, 就可以重叠啦
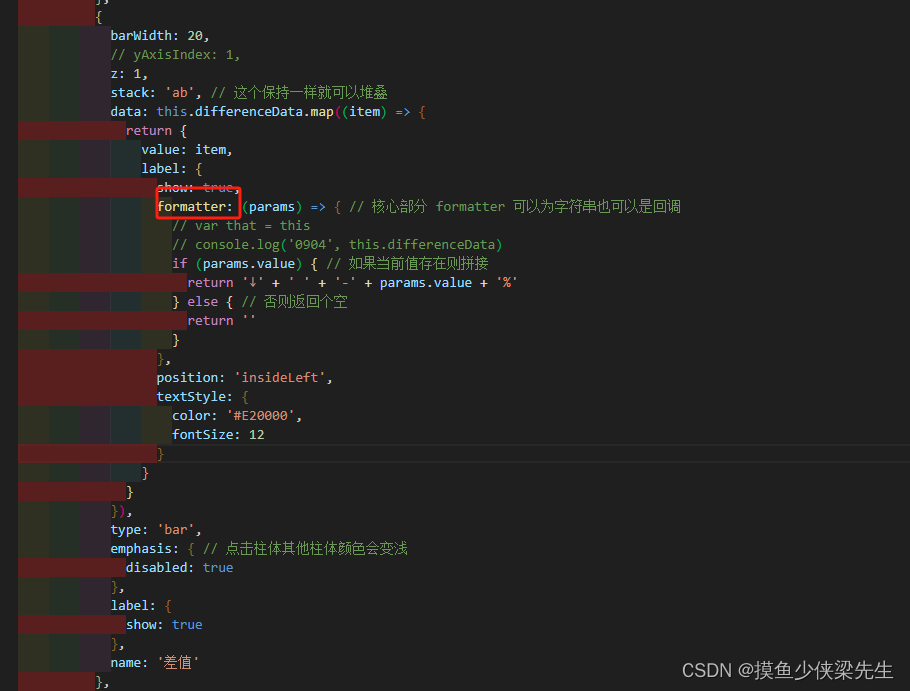
然后设置差值柱体
{barWidth: 20,// yAxisIndex: 1,z: 1,stack: 'ab', // 这个保持一样就可以堆叠data: this.differenceData.map((item) => {return {value: item,label: {show: true,formatter: (params) => { // 核心部分 formatter 可以为字符串也可以是回调// var that = this// console.log('0904', this.differenceData)if (params.value) { // 如果当前值存在则拼接return '↓' + ' ' + '-' + params.value + '%'} else { // 否则返回个空return ''}},position: 'insideLeft',textStyle: {color: '#E20000',fontSize: 12}}}}),type: 'bar',emphasis: { // 点击柱体其他柱体颜色会变浅disabled: true},label: {show: true},name: '差值'},
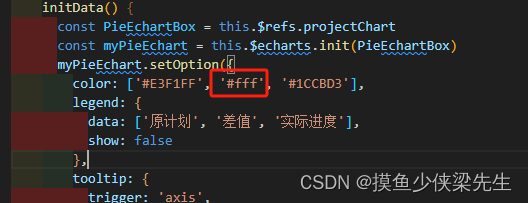
要使差值跟原计划堆叠,他们要是设置 stack: ‘ab’, 这个保持一样就可以堆叠,然后将差值柱体的背景颜色白色
然后将显示的值的位置position改为insideLeft
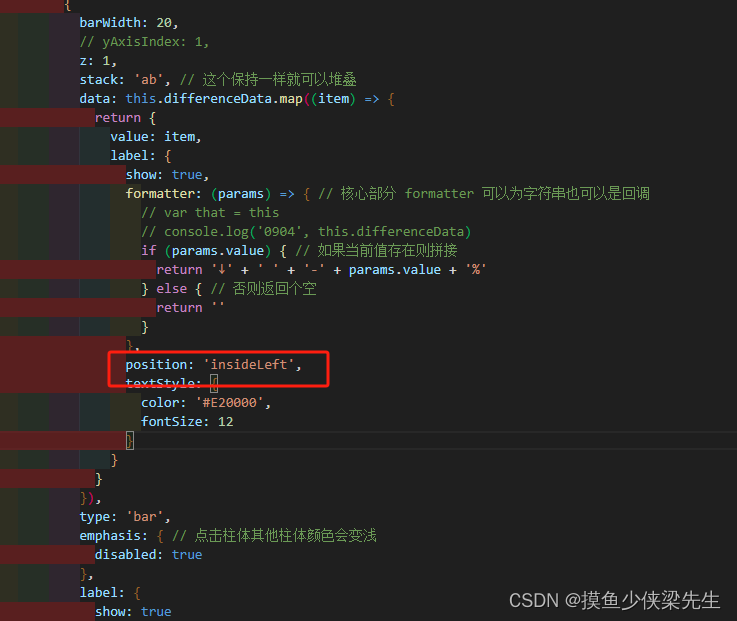
就可以实现上面的效果啦
3.要是重叠的两个柱体不完全重叠
效果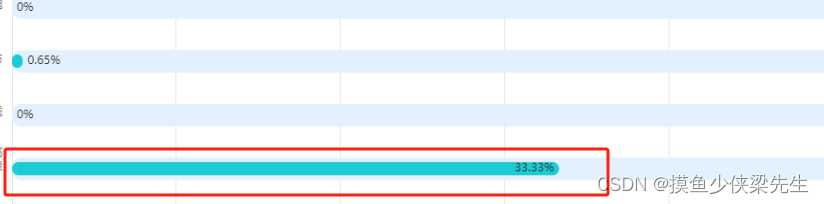
要在原计划设置宽度
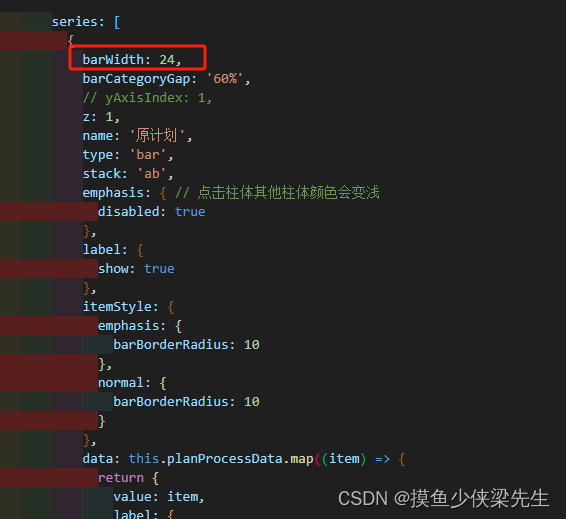
再实际进度中宽度要设置小一点,并且重合度80%
4.设置最大度是100%,但是内容可以超过
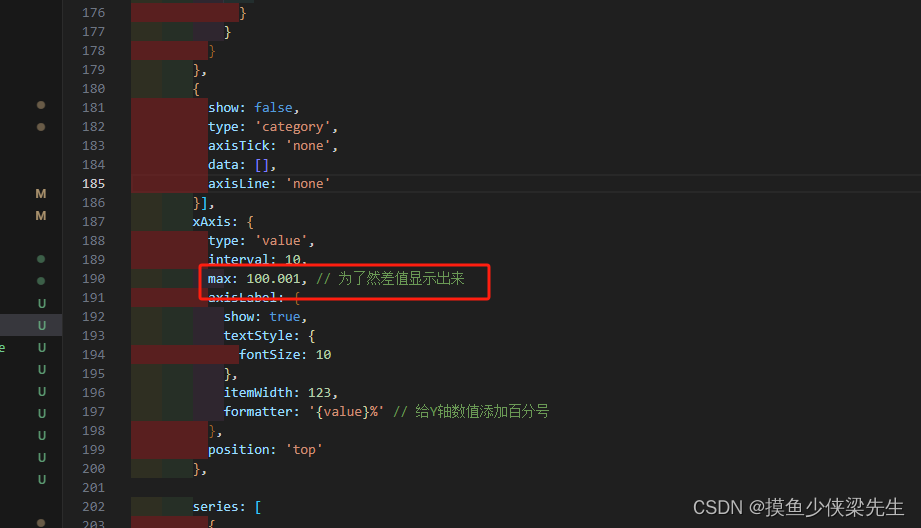
这样子就可以显示出来
5.在series中,在formatter,自定义图片
效果图
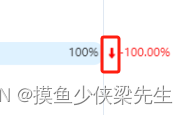
然后再rich里面定义
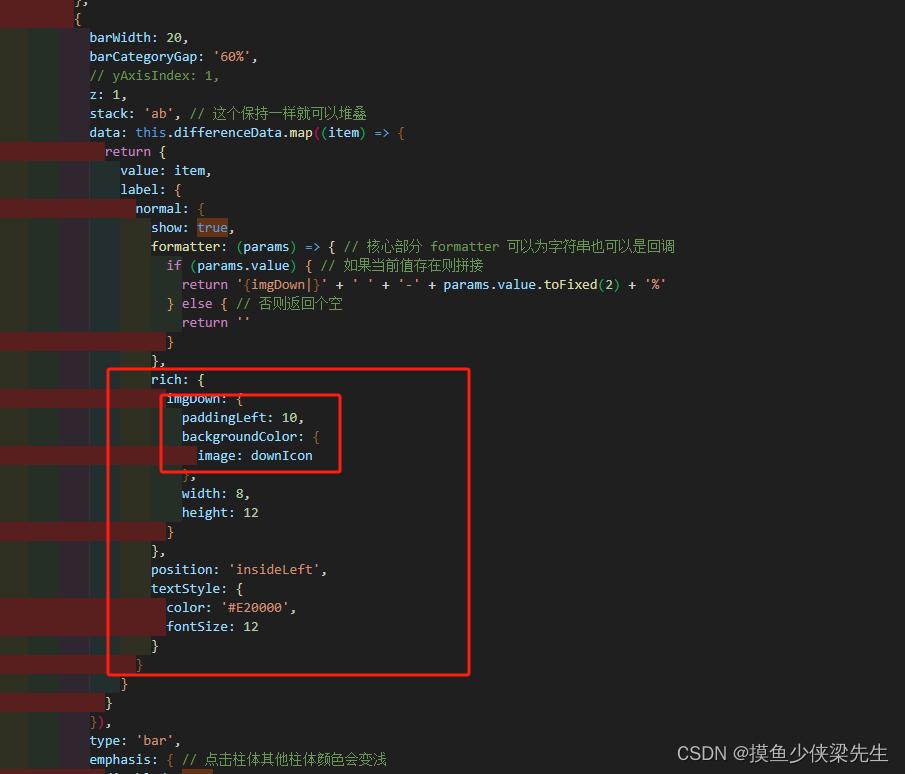
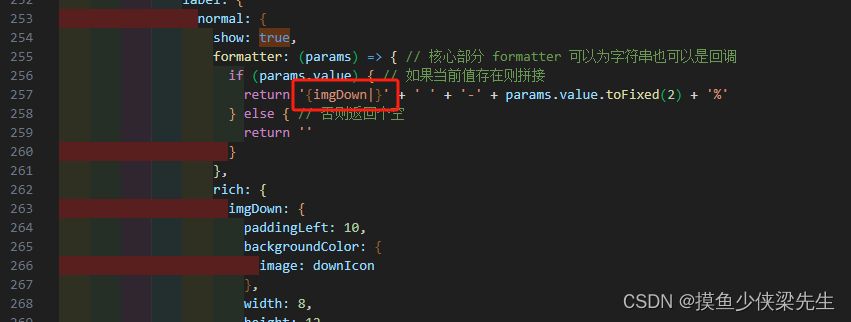
最后在formatter使用
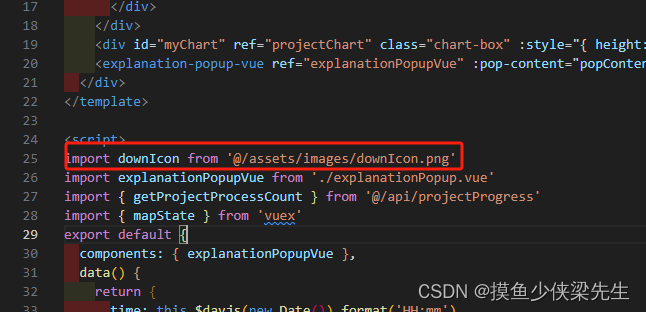
首先要引入图片
补充
1.如果你想在这里使用this,一定要弄箭头函数
2.如果你想要鼠标移到柱体上去,其他一些柱体不会透明
要在在每个柱体里设置
3.给柱状图添加点击事件
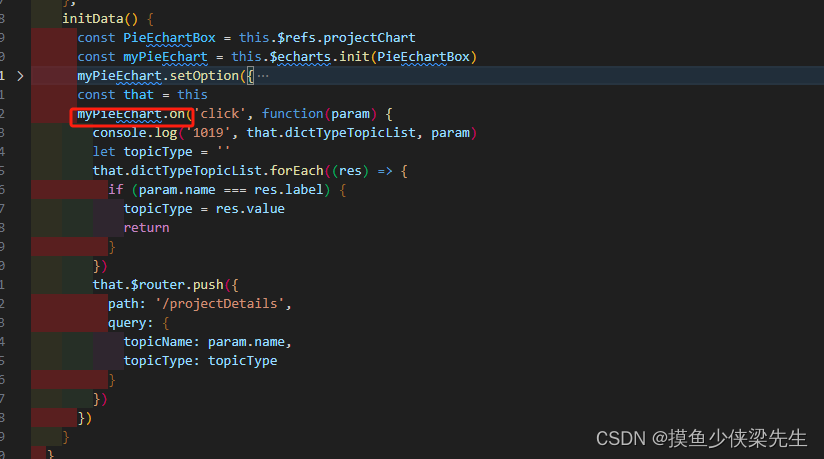
点击事件函数里面也是不能直接获取到this,需要let that = this
完整代码
initData() {const PieEchartBox = this.$refs.projectChartconst myPieEchart = this.$echarts.init(PieEchartBox)myPieEchart.setOption({color: ['#E3F1FF', '#fff', '#1CCBD3'],legend: {data: ['原计划', '差值', '实际进度'],show: false},tooltip: {trigger: 'axis',extraCssText: 'width:200px',valueFormatter: function(value) { // 里面的值加内容return value + '%'},axisPointer: {type: 'shadow'},formatter: "<div style='display:block;word-break: break-all;word-wrap: break-word;white-space:pre-wrap;margin-bottom: 10px'>" + '{b}' + '</div>' +"<div style='display: flex;justify-content: space-between;'><div style='display: flex;align-items: center;'><div style='border-radius: 50%;width: 8px;height: 8px;background: #7ECAD3;margin-right: 10px'></div>" + '<span>' + '{a0}' + '</span></div><div>{c0}%</div></div>' +"<div style='display: flex;justify-content: space-between;'><div style='display: flex;align-items: center;'><div style='border-radius: 50%;width: 8px;height: 8px;background: #5682cc;margin-right: 10px'></div>" + '<span>' + '{a2}' + '</span></div><div>{c2}%</div></div>'},grid: {left: '10',right: '6%',bottom: '3%',top: '2%',containLabel: true},yAxis: [{type: 'category',axisTick: {length: 10},axisLine: 'none',data: this.topicNameData,axisLabel: {margin: 10,interval: 0,lineHeight: 14,textStyle: {fontSize: 12,color: '#666666'},formatter: function(value) {var ret = ''// 拼接加\n返回的类目项var valLength = value.length// X轴类目项的文字个数var maxLength = 10 // 每项显示文字个数var rowN = Math.ceil(valLength / maxLength) // 类目项需要换行的行数if (rowN > 1) { // / 如果类目项的文字大于3,for (var i = 0; i < rowN && i < 2; i++) {var temp = ''// 每次截取的字符串var end = ''var start = i * maxLength// 开始截取的位置if (i === 1 && valLength > 20) {end = start + 9// 结束截取的位置} else {end = start + maxLength// 结束截取的位置}// 这里也可以加一个是否是最后一行的判断,但是不加也没有影响,那就不加吧if (i === 1 && valLength > 20) {temp = value.substring(start, end) + '...'// 结束截取的位置} else {temp = value.substring(start, end) + '\n'// 结束截取的位置}ret += temp // 凭借最终的字符串}return ret} else {return value}}}},{show: false,type: 'category',axisTick: 'none',data: [],axisLine: 'none'}],xAxis: {type: 'value',interval: 10,max: 100.001, // 为了然差值显示出来axisLabel: {show: true,textStyle: {fontSize: 10},itemWidth: 123,formatter: '{value}%' // 给Y轴数值添加百分号},position: 'top'},series: [{barWidth: 24,barCategoryGap: '60%',// yAxisIndex: 1,z: 1,name: '原计划',type: 'bar',stack: 'ab',emphasis: { // 点击柱体其他柱体颜色会变浅disabled: true},label: {show: true},itemStyle: {emphasis: {barBorderRadius: 10},normal: {barBorderRadius: 10}},data: this.planProcessData.map((item) => {return {value: item,label: {show: !(item < 10),formatter: item + '%',position: 'insideRight',textStyle: {color: '#262626',fontSize: 12}}}})},{barWidth: 20,barCategoryGap: '60%',// yAxisIndex: 1,z: 1,stack: 'ab', // 这个保持一样就可以堆叠data: this.differenceData.map((item) => {return {value: item,label: {normal: {show: true,formatter: (params) => { // 核心部分 formatter 可以为字符串也可以是回调if (params.value) { // 如果当前值存在则拼接return '{imgDown|}' + ' ' + '-' + params.value.toFixed(2) + '%'} else { // 否则返回个空return ''}},rich: {imgDown: {paddingLeft: 10,backgroundColor: {image: downIcon},width: 8,height: 12}},position: 'insideLeft',textStyle: {color: '#E20000',fontSize: 12}}}}}),type: 'bar',emphasis: { // 点击柱体其他柱体颜色会变浅disabled: true},label: {show: true},name: '差值'},{barGap: '-80%', /* 可以重叠*/barWidth: 14,barCategoryGap: '60%',yAxisIndex: 0,z: 2,itemStyle: {emphasis: {barBorderRadius: 10},normal: {barBorderRadius: 10}},data: this.realityProcessData.map((item) => {return {value: item,label: {show: true,formatter: item + '%',position: item < 10 ? 'right' : 'insideRight',textStyle: {color: '#262626',fontSize: 12}}}}),type: 'bar',label: {show: true},emphasis: { // 点击柱体其他柱体颜色会变浅disabled: true},name: '实际进度'}]})const that = thismyPieEchart.on('click', function(param) {console.log('1019', that.dictTypeTopicList, param)let topicType = ''that.dictTypeTopicList.forEach((res) => {if (param.name === res.label) {topicType = res.valuereturn}})that.$router.push({path: '/projectDetails',query: {topicName: param.name,topicType: topicType}})})}
这篇关于echarts的柱状图的重叠和堆叠实现两个柱体的显示和之前的差值显示的文章就介绍到这儿,希望我们推荐的文章对编程师们有所帮助!


