本文主要是介绍matplotlib中matshow和imshow的区别,希望对大家解决编程问题提供一定的参考价值,需要的开发者们随着小编来一起学习吧!
matplotlib中matshow和imshow的区别
1.matshow
如下,即在一个图形窗口中将数组作为矩阵展示
def matshow(A, fignum=None, **kwargs):"""Display an array as a matrix in a new figure window.The origin is set at the upper left hand corner and rows (firstdimension of the array) are displayed horizontally. The aspectratio of the figure window is that of the array, unless this wouldmake an excessively short or narrow figure.Tick labels for the xaxis are placed on top.Parameters----------A : array-like(M, N)The matrix to be displayed.fignum : None or int or FalseIf *None*, create a new figure window with automatic numbering.If a nonzero integer, draw into the figure with the given number(create it if it does not exist).If 0, use the current axes (or create one if it does not exist)... note::Because of how `.Axes.matshow` tries to set the figure aspectratio to be the one of the array, strange things may happen if youreuse an existing figure.Returns-------image : `~matplotlib.image.AxesImage`Other Parameters----------------**kwargs : `~matplotlib.axes.Axes.imshow` arguments"""效果图如下:

2.imshow
展示图像数据在一个二维普通光栅中
def imshow(self, X, cmap=None, norm=None, aspect=None,interpolation=None, alpha=None, vmin=None, vmax=None,origin=None, extent=None, shape=None, filternorm=1,filterrad=4.0, imlim=None, resample=None, url=None, **kwargs):"""Display an image, i.e. data on a 2D regular raster.Parameters----------X : array-like or PIL imageThe image data. Supported array shapes are:- (M, N): an image with scalar data. The data is visualizedusing a colormap.- (M, N, 3): an image with RGB values (0-1 float or 0-255 int).- (M, N, 4): an image with RGBA values (0-1 float or 0-255 int),i.e. including transparency.The first two dimensions (M, N) define the rows and columns ofthe image.Out-of-range RGB(A) values are clipped.cmap : str or `~matplotlib.colors.Colormap`, optionalThe Colormap instance or registered colormap name used to mapscalar data to colors. This parameter is ignored for RGB(A) data.Defaults to :rc:`image.cmap`.norm : `~matplotlib.colors.Normalize`, optionalThe `Normalize` instance used to scale scalar data to the [0, 1]range before mapping to colors using *cmap*. By default, a linearscaling mapping the lowest value to 0 and the highest to 1 is used.This parameter is ignored for RGB(A) data.aspect : {'equal', 'auto'} or float, optionalControls the aspect ratio of the axes. The aspect is of particularrelevance for images since it may distort the image, i.e. pixelwill not be square.This parameter is a shortcut for explicitly calling`.Axes.set_aspect`. See there for further details.- 'equal': Ensures an aspect ratio of 1. Pixels will be square(unless pixel sizes are explicitly made non-square in datacoordinates using *extent*).- 'auto': The axes is kept fixed and the aspect is adjusted sothat the data fit in the axes. In general, this will result innon-square pixels.If not given, use :rc:`image.aspect` (default: 'equal').interpolation : str, optionalThe interpolation method used. If *None*:rc:`image.interpolation` is used, which defaults to 'nearest'.Supported values are 'none', 'nearest', 'bilinear', 'bicubic','spline16', 'spline36', 'hanning', 'hamming', 'hermite', 'kaiser','quadric', 'catrom', 'gaussian', 'bessel', 'mitchell', 'sinc','lanczos'.If *interpolation* is 'none', then no interpolation is performedon the Agg, ps, pdf and svg backends. Other backends will fall backto 'nearest'. Note that most SVG renders perform interpolation atrendering and that the default interpolation method they implementmay differ.See:doc:`/gallery/images_contours_and_fields/interpolation_methods`for an overview of the supported interpolation methods.Some interpolation methods require an additional radius parameter,which can be set by *filterrad*. Additionally, the antigrain imageresize filter is controlled by the parameter *filternorm*.alpha : scalar, optionalThe alpha blending value, between 0 (transparent) and 1 (opaque).This parameter is ignored for RGBA input data.vmin, vmax : scalar, optionalWhen using scalar data and no explicit *norm*, *vmin* and *vmax*define the data range that the colormap covers. By default,the colormap covers the complete value range of the supplieddata. *vmin*, *vmax* are ignored if the *norm* parameter is used.origin : {'upper', 'lower'}, optionalPlace the [0,0] index of the array in the upper left or lower leftcorner of the axes. The convention 'upper' is typically used formatrices and images.If not given, :rc:`image.origin` is used, defaulting to 'upper'.Note that the vertical axes points upward for 'lower'but downward for 'upper'.extent : scalars (left, right, bottom, top), optionalThe bounding box in data coordinates that the image will fill.The image is stretched individually along x and y to fill the box.The default extent is determined by the following conditions.Pixels have unit size in data coordinates. Their centers are oninteger coordinates, and their center coordinates range from 0 tocolumns-1 horizontally and from 0 to rows-1 vertically.Note that the direction of the vertical axis and thus the defaultvalues for top and bottom depend on *origin*:- For ``origin == 'upper'`` the default is``(-0.5, numcols-0.5, numrows-0.5, -0.5)``.- For ``origin == 'lower'`` the default is``(-0.5, numcols-0.5, -0.5, numrows-0.5)``.See the example :doc:`/tutorials/intermediate/imshow_extent` for amore detailed description.filternorm : bool, optional, default: TrueA parameter for the antigrain image resize filter (see theantigrain documentation). If *filternorm* is set, the filternormalizes integer values and corrects the rounding errors. Itdoesn't do anything with the source floating point values, itcorrects only integers according to the rule of 1.0 which meansthat any sum of pixel weights must be equal to 1.0. So, thefilter function must produce a graph of the proper shape.filterrad : float > 0, optional, default: 4.0The filter radius for filters that have a radius parameter, i.e.when interpolation is one of: 'sinc', 'lanczos' or 'blackman'.resample : bool, optionalWhen *True*, use a full resampling method. When *False*, onlyresample when the output image is larger than the input image.url : str, optionalSet the url of the created `.AxesImage`. See `.Artist.set_url`.Returns-------image : `~matplotlib.image.AxesImage`Other Parameters----------------**kwargs : `~matplotlib.artist.Artist` propertiesThese parameters are passed on to the constructor of the`.AxesImage` artist.See also--------matshow : Plot a matrix or an array as an image.Notes-----Unless *extent* is used, pixel centers will be located at integercoordinates. In other words: the origin will coincide with the centerof pixel (0, 0).There are two common representations for RGB images with an alphachannel:- Straight (unassociated) alpha: R, G, and B channels represent thecolor of the pixel, disregarding its opacity.- Premultiplied (associated) alpha: R, G, and B channels representthe color of the pixel, adjusted for its opacity by multiplication.`~matplotlib.pyplot.imshow` expects RGB images adopting the straight(unassociated) alpha representation."""同一个矩阵展示效果如下:
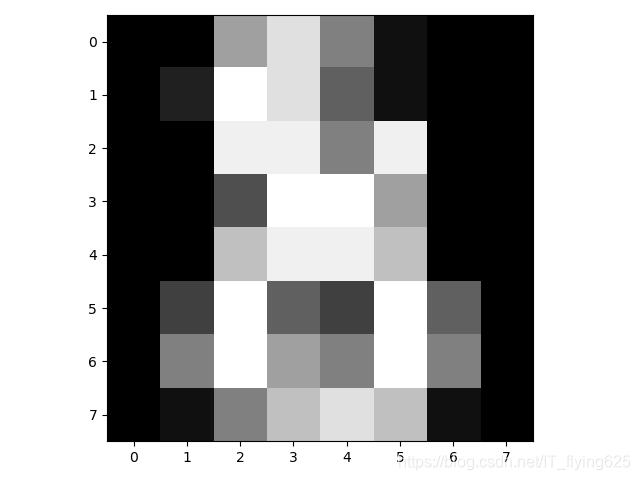
与上面对比我们可以看到图像的坐标默认是不同的。
详细可参阅官方文档。
https://matplotlib.org/api/_as_gen/matplotlib.axes.Axes.matshow.html#matplotlib.axes.Axes.matshow
https://matplotlib.org/api/_as_gen/matplotlib.axes.Axes.imshow.html#matplotlib.axes.Axes.imshow
这篇关于matplotlib中matshow和imshow的区别的文章就介绍到这儿,希望我们推荐的文章对编程师们有所帮助!


