本文主要是介绍iperf/iperf3 测试网络性能,希望对大家解决编程问题提供一定的参考价值,需要的开发者们随着小编来一起学习吧!
一、简介
iPerf3 是一种用于测量网络上最大带宽的工具。这是一个新的实现,它与原始 iPerf 不共享任何代码,也不向后兼容。 iPerf 最初由 NLANR/DAST 开发,iPerf3 主要由 ESnet / 劳伦斯伯克利国家实验室开发。
iPerf features
- TCP and SCTP
- Measure bandwidth
- Report MSS/MTU size and observed read sizes.
- Support for TCP window size via socket buffers.
- UDP
- Client can create UDP streams of specified bandwidth.
- Measure packet loss
- Measure delay jitter
- Multicast capable
- Cross-platform: Windows, Linux, Android, MacOS X, FreeBSD, OpenBSD, NetBSD, VxWorks, Solaris,...
- Client and server can have multiple simultaneous connections (-P option).
- Server handles multiple connections, rather than quitting after a single test.
- Can run for specified time (-t option), rather than a set amount of data to transfer (-n or -k option).
- Print periodic, intermediate bandwidth, jitter, and loss reports at specified intervals (-i option).
- Run the server as a daemon (-D option)
- Use representative streams to test out how link layer compression affects your achievable bandwidth (-F option).
- A server accepts a single client simultaneously (iPerf3) multiple clients simultaneously (iPerf2)
- New: Ignore TCP slowstart (-O option).
- New: Set target bandwidth for UDP and (new) TCP (-b option).
- New: Set IPv6 flow label (-L option)
- New: Set congestion control algorithm (-C option)
- New: Use SCTP rather than TCP (--sctp option)
- New: Output in JSON format (-J option).
- New: Disk read test (server: iperf3 -s / client: iperf3 -c testhost -i1 -F filename)
- New: Disk write tests (server: iperf3 -s -F filename / client: iperf3 -c testhost -i1)
二、使用方法
iperf的命令参数共分为三类,分别是客户端与服务器端公用参数、服务器端专用参数和客户端专用参数,下面对常用的选项进行介绍。
| GENERAL OPTIONS | |
|---|---|
| Command line option | Description |
| -p, --port n | The server port for the server to listen on and the client to connect to. This should be the same in both client and server. Default is 5201. |
| --cport n | Option to specify the client-side port. (new in iPerf 3.1) |
| -f, --format [kmKM] | 速率显示单位 A letter specifying the format to print bandwidth numbers in. Supported formats are 'k' = Kbits/sec 'K' = KBytes/sec'm' = Mbits/sec 'M' = MBytes/secThe adaptive formats choose between kilo- and mega- as appropriate. |
| -i, --interval n | 设置每次报告之间的时间间隔,单位为秒。 Sets the interval time in seconds between periodic bandwidth, jitter, and loss reports. If non-zero, a report is made every interval seconds of the bandwidth since the last report. If zero, no periodic reports are printed. Default is zero. |
| -F, --file name | 指定要传输的文件。 client-side: read from the file and write to the network, instead of using random data; |
| -A, --affinity n/n,m-F | 设置cpu的亲和性,可以指定某一个逻辑cpu运行。 Set the CPU affinity, if possible (Linux and FreeBSD only). On both the client and server you can set the local affinity by using the n form of this argument (where n is a CPU number). In addition, on the client side you can override the server’s affinity for just that one test, using the n,m form of argument. Note that when using this feature, a process will only be bound to a single CPU (as opposed to a set containing potentialy multiple CPUs). |
| -B, --bind host | Bind to host, one of this machine's addresses. For the client this sets the outbound interface. For a server this sets the incoming interface. This is only useful on multihomed hosts, which have multiple network interfaces. |
| -V, --verbose | give more detailed output |
| -J, --json | output in JSON format |
| --logfile file | send output to a log file. (new in iPerf 3.1) |
| --d, --debug | emit debugging output. Primarily (perhaps exclusively) of use to developers. |
| -v, --version | Show version information and quit. |
| -h, --help | Show a help synopsis and quit. |
| SERVER SPECIFIC OPTIONS | |
| Command line option | Description |
| -s, --server | Run iPerf in server mode. (This will only allow one iperf connection at a time) |
| -D, --daemon | Run the server in background as a daemon. |
| -I, --pidfilefile | write a file with the process ID, most useful when running as a daemon. (new in iPerf 3.1) |
| CLIENT SPECIFIC OPTIONS | |
| Command line option | Description |
| -c, --client host | Run iPerf in client mode, connecting to an iPerf server running on host. |
| --sctp | Use SCTP rather than TCP (Linux, FreeBSD and Solaris). (new in iPerf 3.1) |
| -u, --udp | Use UDP rather than TCP. See also the -b option. |
| -b, --bandwidth n[KM] | 限制测试带宽。UDP 默认为 1Mbit/秒,TCP 默认无限制 Set target bandwidth to n bits/sec (default 1 Mbit/sec for UDP, unlimited for TCP). If there are multiple streams (-P flag), the bandwidth limit is applied separately to each stream. You can also add a ’/’ and a number to the bandwidth specifier. This is called "burst mode". It will send the given number of packets without pausing, even if that temporarily exceeds the specified bandwidth limit. |
| -t, --time n | 以时间为测试结束条件进行测试,默认为 10 秒 The time in seconds to transmit for. iPerf normally works by repeatedly sending an array of len bytes for time seconds. Default is 10 seconds. See also the -l, -k and -n options. |
| -n, --num n[KM] | 以数据传输大小为测试结束条件进行测试 The number of buffers to transmit. Normally, iPerf sends for 10 seconds. The -n option overrides this and sends an array of len bytes num times, no matter how long that takes. See also the -l, -k and -t options. |
| -k, --blockcount n[KM] | 以传输数据包数量为测试结束条件进行测试 The number of blocks (packets) to transmit. (instead of -t or -n) See also the -t, -l and -n options. |
| -l, --length n[KM] | 读写缓冲区的长度,TCP 默认为 128K,UDP 默认为 8K; The length of buffers to read or write. iPerf works by writing an array of len bytes a number of times. Default is 128 KB for TCP, 8 KB for UDP. See also the -n, -k and -t options. |
| -P, --parallel n | The number of simultaneous connections to make to the server. Default is 1. |
| -R, --reverse | Run in reverse mode (server sends, client receives). |
| -w, --window n[KM] | 设置套接字缓冲区大小,TCP 模式下为窗口大小; Sets the socket buffer sizes to the specified value. For TCP, this sets the TCP window size. (this gets sent to the server and used on that side too) |
| -M, --set-mss n | 设置 TCP/SCTP 最大分段长度(MSS,MTU 减 40 字节) Attempt to set the TCP maximum segment size (MSS). The MSS is usually the MTU - 40 bytes for the TCP/IP header. For ethernet, the MSS is 1460 bytes (1500 byte MTU). |
| -N, --no-delay | 设置 TCP/SCTP no delay,屏蔽 Nagle 算法; Set the TCP no delay option, disabling Nagle's algorithm. Normally this is only disabled for interactive applications like telnet. |
| -4, --version4 | only use IPv4. |
| -6, --version4 | only use IPv6. |
| -S, --tos n | The type-of-service for outgoing packets. (Many routers ignore the TOS field.) You may specify the value in hex with a '0x' prefix, in octal with a '0' prefix, or in decimal. For example, '0x10' hex = '020' octal = '16' decimal. The TOS numbers specified in RFC 1349 are: IPTOS_LOWDELAY minimize delay 0x10IPTOS_THROUGHPUT maximize throughput 0x08IPTOS_RELIABILITY maximize reliability 0x04IPTOS_LOWCOST minimize cost 0x02 |
| -L, --flowlabel n | 设置 IPv6 流标签 Set the IPv6 flow label (currently only supported on Linux). |
| -Z, --zerocopy | 使用 “zero copy”(零拷贝)方法发送数据; Use a "zero copy" method of sending data, such as sendfile(2), instead of the usual write(2). This uses much less CPU. |
| -O, --omit n | 忽略前 n 秒的测试 Omit the first n seconds of the test, to skip past the TCP TCP slowstart period. |
| -T, --title str | Prefix every output line with this string. |
| -C, --linux-congestion algo | 设置 TCP 拥塞控制算法 Set the congestion control algorithm (Linux only for iPerf 3.0, Linux and FreeBSD for iPerf 3.1). |
See also GitHub - esnet/iperf: iperf3: A TCP, UDP, and SCTP network bandwidth measurement tool
三、常见使用场景
3.2、测试UDP丢包和延迟
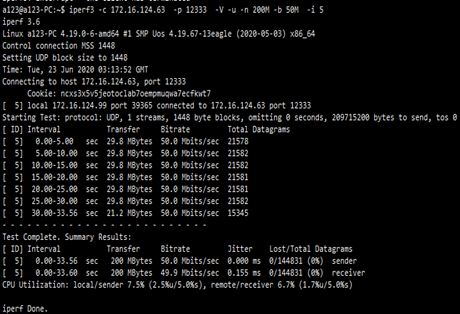
iperf也可以用于UDP数据包吞吐量、丢包率和延迟指标,但是由于UDP协议是一个非面向连接的轻量级传输协议,并且不提供可靠的数据传输服务,因此对UDP应用的关注点不是传输数据有多快,而是它的丢包率和延时指标。通过iperf的“-u”参数即可测试UDP应用的传输性能
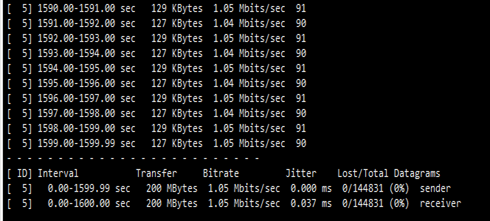
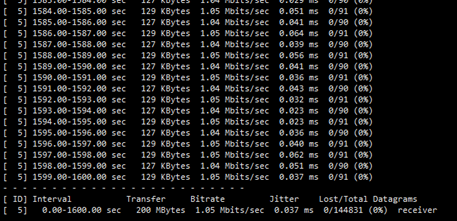
增加参数 –b 指定带宽,-n 指定传输的数据量
ref:
iPerf - The TCP, UDP and SCTP network bandwidth measurement tool
18张图带你了解衡量网络性能的四大指标:带宽、时延、抖动、丢包 - 知乎
网络性能测试工具iperf的使用与参数解析_【ql君】qlexcel的博客-CSDN博客_iperf结果分析
iperf网络性能测试工具_mob604756f61e6c的技术博客_51CTO博客
iperf—流量测试 - 灵笑若然 - 博客园
这篇关于iperf/iperf3 测试网络性能的文章就介绍到这儿,希望我们推荐的文章对编程师们有所帮助!


