本文主要是介绍大数据实训(爬取前程无忧利用hive、sqoop分析),希望对大家解决编程问题提供一定的参考价值,需要的开发者们随着小编来一起学习吧!
一、总体要求
利用python编写爬虫程序,从招聘网站上爬取数据,将数据存入到MongoDB数据库中,将存入的数据作一定的数据清洗后做数据分析,最后将分析的结果做数据可视化。
二、环境
hadoop:https://editor.csdn.net/md/?articleId=106674836
hive:链接:https://pan.baidu.com/s/1dBVZN1iOB8Okqv8lD_h_Eg
提取码:mjx4
zookeeper:https://editor.csdn.net/md/?articleId=106788153
flume:https://editor.csdn.net/md/?articleId=106695309
sqoop:https://editor.csdn.net/md/?articleId=106837578
三、爬取字段(前程无忧、应届生)
1、具体要求:职位名称、薪资水平、招聘单位、工作地点、工作经验、学历要求、工作内容(岗位职责)、任职要求(技能要求)。
(1)新建一个项目:scrapy startproject pawuyijob
(2)生成一个spider文件:scrapy genspider wuyi wuyi.com
结构如下:

(3)修改settings.py
BOT_NAME = 'pawuyijob'SPIDER_MODULES = ['pawuyijob.spiders']
NEWSPIDER_MODULE = 'pawuyijob.spiders'
USER_AGENT = 'Mozilla/5.0 (Windows NT 10.0; Win64; x64) AppleWebKit/537.36 (KHTML, like Gecko) Chrome/83.0.4103.106 Safari/537.36'
DOWNLOAD_DELAY = 0.5
ITEM_PIPELINES = {'pawuyijob.pipelines.PawuyijobPipeline': 300,
}
(4)编写items.py
代码如下:
import scrapyclass PawuyijobItem(scrapy.Item):# define the fields for your item here like:# name = scrapy.Field()work_place = scrapy.Field() # 工作地点company_name = scrapy.Field() # 公司名称position_name = scrapy.Field() # 职位名称company_info = scrapy.Field() # 公司信息work_salary = scrapy.Field() # 薪资情况release_date = scrapy.Field() # 发布时间job_require = scrapy.Field() # 职位信息contact_way = scrapy.Field() # 联系方式education = scrapy.Field() # 学历work_experience = scrapy.Field()#工作经验pass(5)编写spiders文件
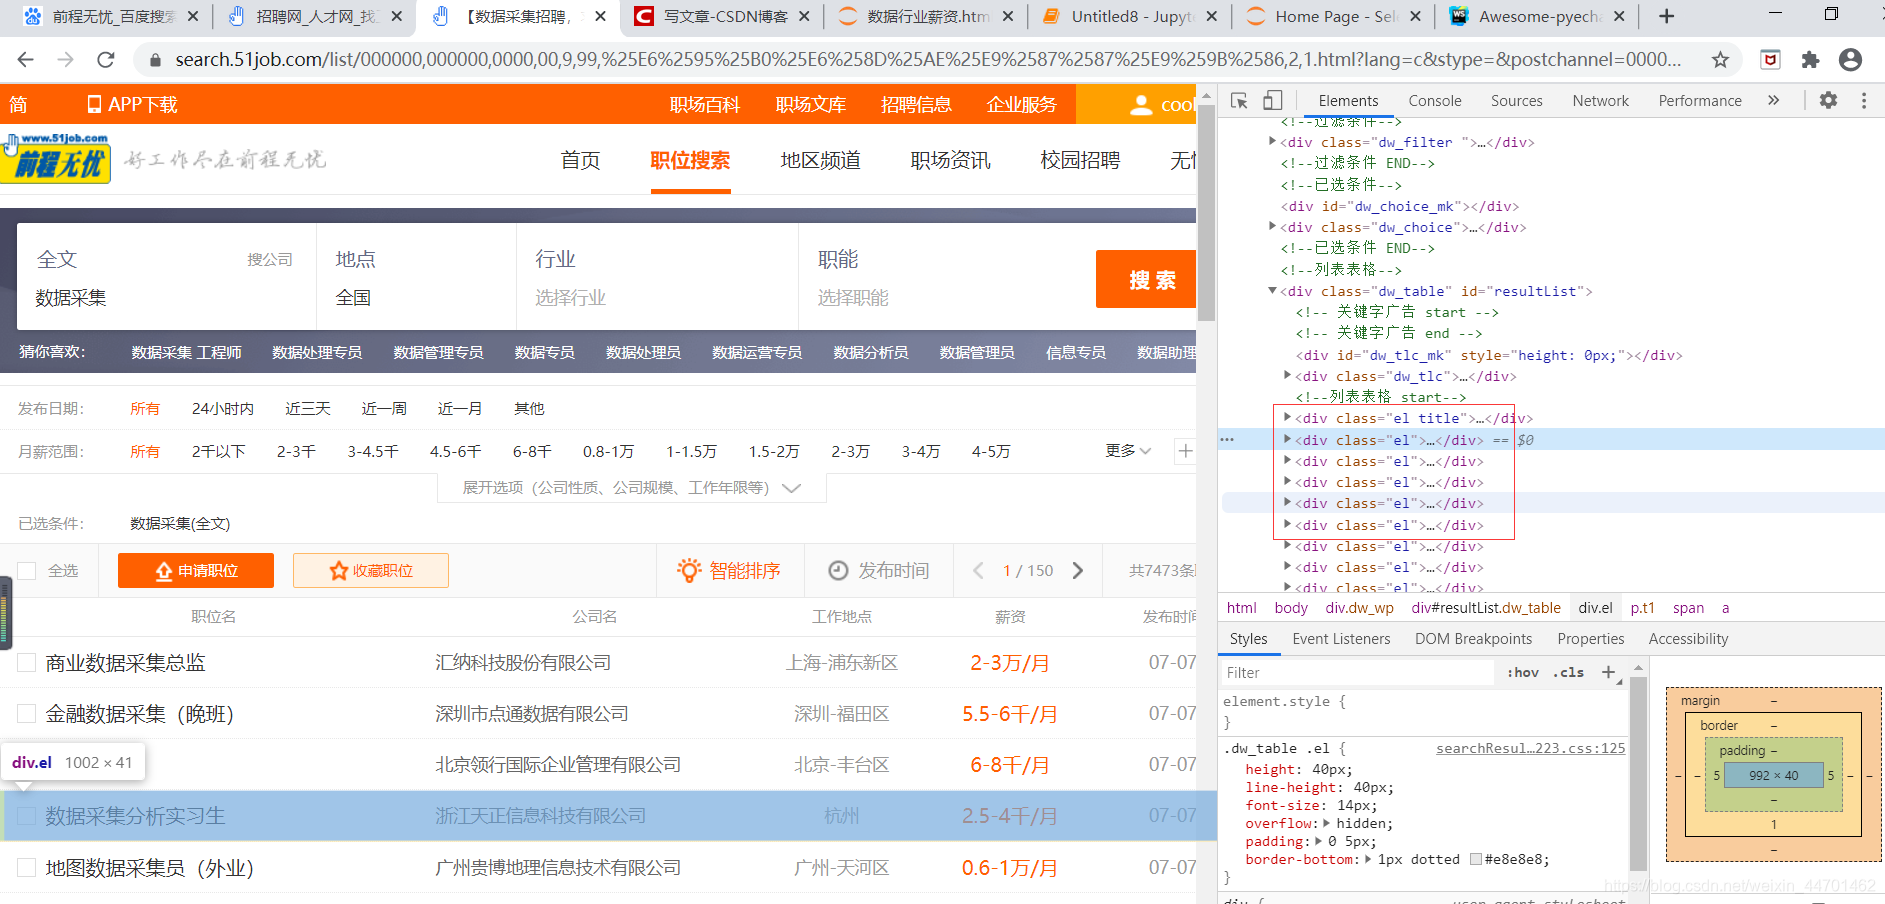
我们最关键的东西就是能够把xpath找正确,很明显我们能看见每行数据都在这个标签中,我们可以写个循环
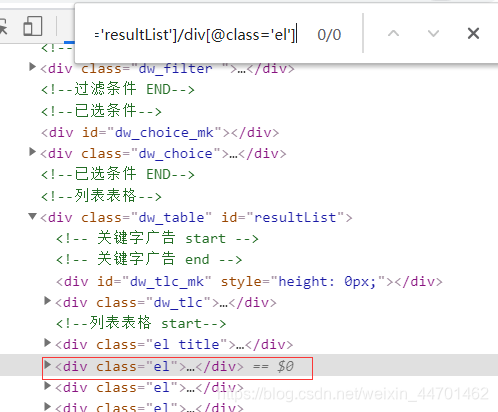
(6)还有我们可以按住ctrl+f,看我们的xpath是否匹配到了
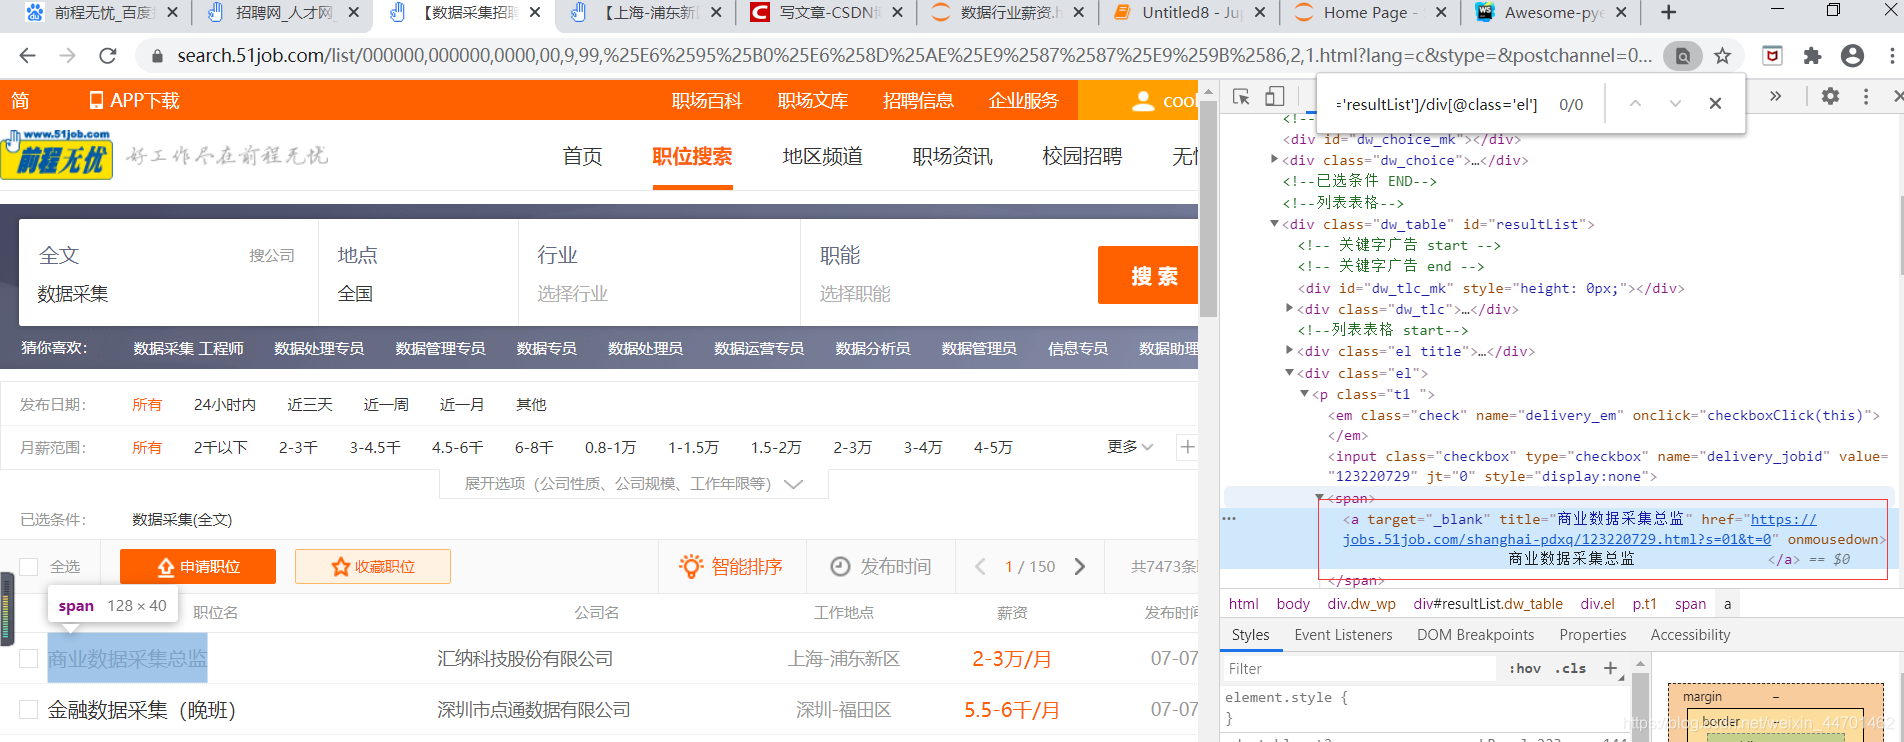
(7)详情页的url
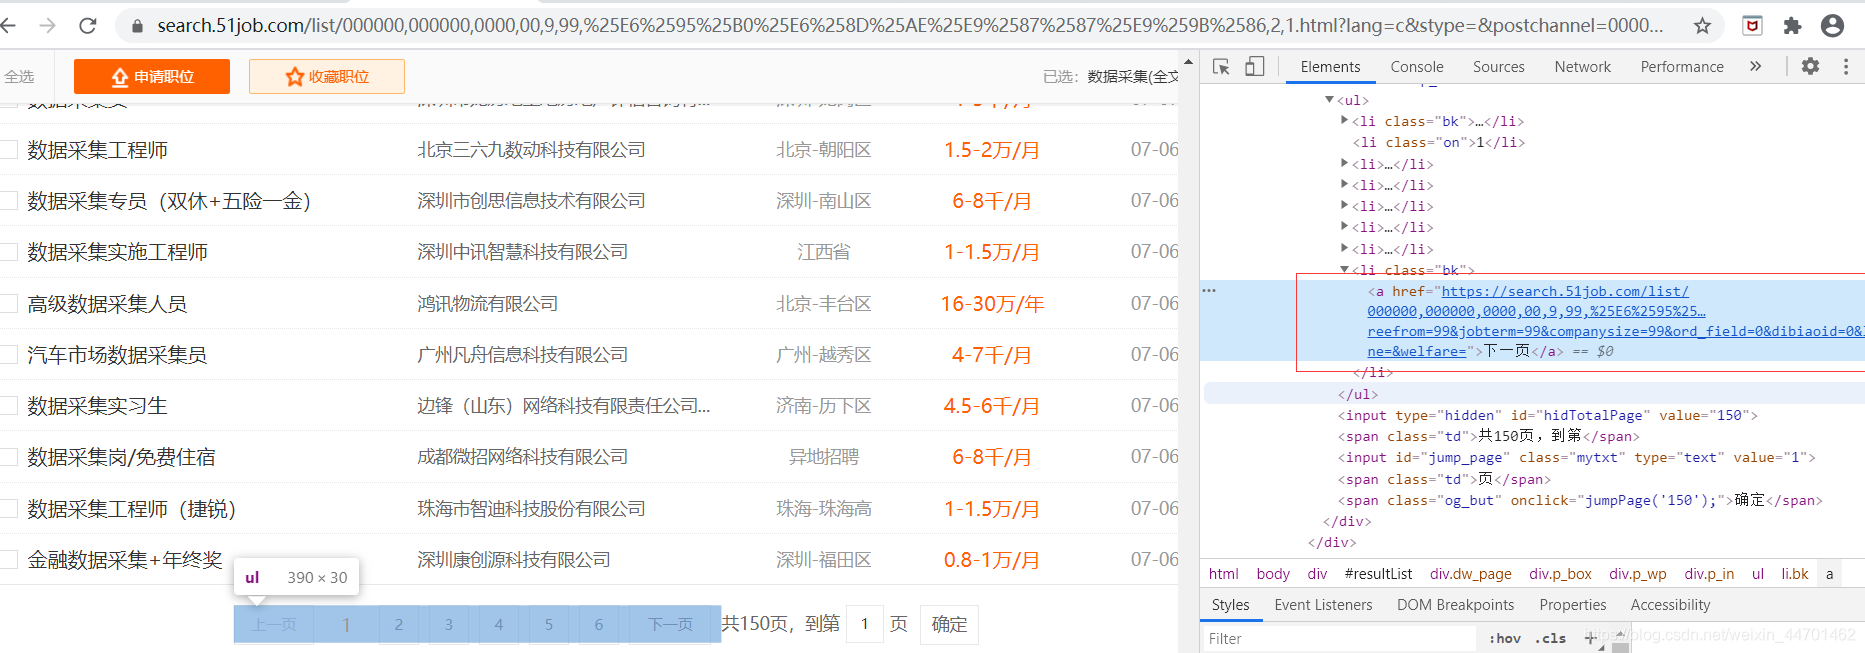
(7)下一页的url:
(8)spider代码如下:
# -*- coding: utf-8 -*-
import scrapyfrom pawuyijob.items import PawuyijobItemclass WuyiSpider(scrapy.Spider):name = 'wuyi'allowed_domains = ['51job.com']start_urls =['https://search.51job.com/list/000000,000000,0130%252C7501%252C7506%252C7502,01%252C32%252C38,9,99,%2520,2,1.html?lang=c&stype=&postchannel=0000&workyear=99&cotype=99°reefrom=99&jobterm=99&companysize=99&providesalary=99&lonlat=0%2C0&radius=-1&ord_field=0&confirmdate=9&fromType=&dibiaoid=0&address=&line=&specialarea=00&from=&welfare=']def parse(self, response):#每条数据存放的xpathnode_list = response.xpath("//div[@id='resultList']/div[@class='el']")# 整个for循环结束代表 当前这一页已经爬完了, 那么就该开始爬取下一页for node in node_list:item = PawuyijobItem()# 职位名称item["position_name"] = node.xpath("./p/span/a/@title").extract_first()# 公司信息item["company_name"] = node.xpath("./span[@class='t2']/a/@title").extract_first()# 工作地点item["work_place"] = node.xpath("./span[@class='t3']/text()").extract_first()# 薪资情况item["work_salary"] = node.xpath("./span[@class='t4']/text()").extract_first()# 发布时间item["release_date"] = node.xpath("./span[@class='t5']/text()").extract_first()#详情页的urldetail_url = node.xpath("./p/span/a/@href").extract_first()yield scrapy.Request(url=detail_url, callback=self.parse_detail, meta={"item": item})#下一页next_url = response.xpath("//div[@class='p_in']//li[@class='bk'][2]/a/@href").extract_first()#如果没有详情页的url我们就返回不再执行if not next_url:returnyield scrapy.Request(url=next_url, callback=self.parse)def parse_detail(self, response):item = response.meta["item"]# 职位信息item["job_require"] = response.xpath("//div[@class='bmsg job_msg inbox']/p/text()").extract()# 联系方式item["contact_way"] = response.xpath("//div[@class='bmsg inbox']/a/text()").extract()# 公司信息item["company_info"] = response.xpath("//div[@class='tmsg inbox']/text()").extract()# 学历item["education"] = response.xpath("//div[@class='tHeader tHjob']/div/div/p[2]/text()").extract()[2]# 工作经验item["work_experience"] = response.xpath("//div[@class='tHeader tHjob']/div/div/p[2]/text()").extract()[1]yield item(9)我们需要把数据存储到mongodb,需要编写我们的pipelines.py
from pymongo import MongoClientclass PawuyijobPipeline(object):def open_spider(self, spider):self.db = MongoClient('localhost', 27017).pawuyijob_db#连接mongodb数据库self.collection = self.db.pawuyijob_collection#连接表def process_item(self, item, spider):self.collection.insert_one(dict(item))return item
(10)我这里是分别存储数据采集、数据开发、数据分析这些表的
运行scapy crawl wuyi
我们来看一下mongodb里面的数据是怎样的
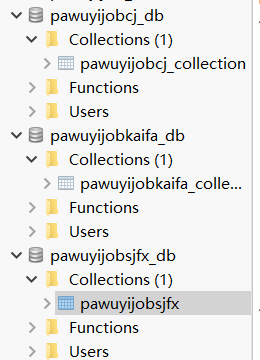
(11)每个数据库中表的数据是怎样的

(12)mongodb导出数据命令(其中-d后面是数据库 -c后面是表 -o后面跟要保存的路径):
mongoexport -d pawuyijobkaifa_db -c pawuyijobkaifa_collection --type=json -o D:\cjdata1.json
四、具体要求:将爬取的数据存储到hdfs上。利用flume收集日志。若整个过程利用mangdb转hdfs则为
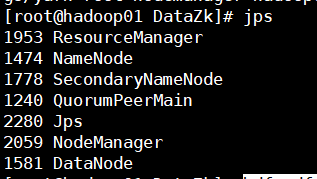
1.正确搭建hadoop平台:
2.正确选择flume协议传输形式
tail-hdfs.conf
配置文件如下:
#name the components on this agent
a1.sources = r1
a1.sinks = k1
a1.channels = c1# Describe/configure the source
a1.sources.r1.type = exec
a1.sources.r1.command = tail -F /home/data/job.txt #监控data目录下
a1.sources.r1.channels = c1# Describe the sink
a1.sinks.k1.type = hdfs
a1.sinks.k1.channel = c1
a1.sinks.k1.hdfs.path =hdfs://hadoop01:9000/flume/tailout/%y-%m-%d/%H-%M/ #把数据收集到hdfs目录下
a1.sinks.k1.hdfs.filePrefix = log-
a1.sinks.k1.hdfs.round = true
a1.sinks.k1.hdfs.roundValue = 10
a1.sinks.k1.hdfs.roundUnit = minute
a1.sinks.k1.hdfs.rollInterval = 3
a1.sinks.k1.hdfs.rollSize = 20
a1.sinks.k1.hdfs.rollCount = 5
a1.sinks.k1.hdfs.batchSize = 1
a1.sinks.k1.hdfs.useLocalTimeStamp = true
#生成的文件类型,默认是Sequencefile,可用DataStream,则为普通文本
a1.sinks.k1.hdfs.fileType = DataStream# Use a channel which buffers events in memory
a1.channels.c1.type = memory
a1.channels.c1.capacity = 1000
a1.channels.c1.transactionCapacity = 100
3、运行:
../bin/flume-ng agent -c conf -f tail-hdfs.conf -name a1 -Dflume.root.logger=DEBUG,console
4、查看一下hdfs上面的文件

5.能将数据存储到hdfs
命令:
hdfs dfs -put /home/tmpdata/job.txt /user

五、(1)具体要求(要求:1、利用hive进行分析,2、将hive分析结果利用sqoop技术存储到mysql数据库中,并最后显示分析结果。):
1、分析“数据分析”、“大数据开发工程师”、“数据采集”等岗位的平均工资、最高工资、最低工资,并作条形图将结果展示出来;
启动hive:

2.创建一个数据库:
create database job;
use job;
3.创建一个表(表里面要包含数据里面的字段):
create table job(id string,position_name string,company_name string,work_place string,work_salary string,release_date string,job_require string,contact_way string,company_info string,education string,work_experience string)row format delimited fields terminated by ','
stored as textfile ;
create table job8(id string,position_name string,company_name string,work_place string,work_salary string,release_date string,education string,work_experience string)row format delimited fields terminated by ','
stored as textfile ;
4.将数据从hdfs上面传入到表中
load data inpath 'hdfs://hadoop01:9000/user/job.txt' into table job;
5.我们需要把这个表里面的position_name,work_salary数据拿取出来并且去掉引号
create table job1 as select regexp_replace(position_name,'"','')as position_name,regexp_replace(work_salary,'"','')as work_salary from job;查询一下结果:
select * from job;
结果如下:

6.把该position_name,work_salary数据进行去重:
create table job2 as select position_name,work_salary from job1 group by position_name,work_salary;7.将数据分析的position_name,work_salary全部字段拿取出来:
create table job3 as select position_name,work_salary from job2 where position_name like '%数据分析';
8.数据采集:创建一个表job4里面有position_name,work_salary字段
create table job4 as select position_name,work_salary from job2 where position_name like '%数据采集%';9.大数据开发:创建一个表job5里面有position_name,work_salary字段
create table job5 as select position_name,work_salary from job2 where position_name like '%大数据开发%';
10.创建一个只有work_salary分析的表(数据开发):
create table fx as select work_salary from job3;

11.将上面的表里面的引号去掉work_salary:
create table fx1 as select regexp_replace(work_salary,'work_salary:','')as work_salary from fx;

12.将里面的空值换掉
create table fx2 as select regexp_replace(work_salary,'null','')as work_salary from fx2;
insert overwrite table fx1 select * from fx1 where work_salary is not null;
效果图:

13.去重:
create table fx2 as select work_salary from fx1 group by work_salary;
14.去除数据里面的null值
insert overwrite table fx1 select * from fx1 where work_salary is not null;
15.创建一个表fx2用来保存去除后的里面的work_salary:
create table fx2 as select regexp_replace(work_salary,'work_salary:','')as work_salary from fx1;
16.创建一个表去掉重复的数据:
create table fx4 as select * from fx3 group by work_salary;
17.得到按年的工资:
create table cj_y as select * from fx4 where work_salary like '%年';
18.得到按月的工资:
create table cj_m as select * from fx4 where work_salary like '%月';
19.去掉月
create table cj_y1 as select regexp_replace(work_salary,'/年','')as work_salary from cj_y;create table cj_m1 as select regexp_replace(work_salary,'/月','')as work_salary from cj_m;
20.得到千的工资分别创建cj_m2,cj_mw2,cj_y2表,让里面只有数字
create table cj_m2 as select regexp_replace(work_salary,'千','')as work_salary from cj_m1 where work_salary like '%千';
create table cj_mw2 as select regexp_replace(work_salary,'万','')as work_salary from cj_m1 where work_salary like '%万';
create table cj_y2 as select regexp_replace(work_salary,'万','')as work_salary from cj_y1 where work_salary like '%万';
21.创建表分别为cj_m3,cj_mw3,cj_y3 切分表里面的数据,方便后面的计算
create table cj_m3 as select split(work_salary,'-')[0] as min,split(work_salary,'-')[1] as max from cj_m2;create table cj_mw3 as select split(work_salary,'-')[0] as min ,split(work_salary,'-')[1] as max from cj_mw2;create table cj_y3 as select split(work_salary,'-')[0] as min ,split(work_salary,'-')[1] as max from cj_y2;
22.分别创建表,cj_m4, cj_mw4得到平均值和1000
create table cj_m4 as select min*1000 as min,max*1000 as max,(min+max)/2*1000 as avg from cj_m3;
create table cj_mw4 as select min*10000 as min,max*10000 as max,(min+max)/2*10000 as avg from cj_mw3;
23.创建一个表cj_y4,除以12求到每个月的
create table cj_y4 as select min*10000/12 as min,max*10000/12 as max,(min+max)/2*10000/12 as avg from cj_y3;
24.放到一个表里
insert into cj_y4 select * from cj_m4;
insert into cj_y4 select * from cj_mw4;
25.得到数据
create table cj_result as select min(min) as min,max(max) as max,avg(avg) as avg from cj_y4;
查看hive表的位置
show create table shuju10;
'hdfs://hadoop01:9000/user/hive/warehouse/job.db/表名'
26.在mysql建立相应的表

27.利用sqoop将hive数据导出到mysql
sqoop export --connect "jdbc:mysql://localhost:3306/test?characterEncoding=UTF-8" --username root --password 123456 --table fx_result --fields-terminated-by '\001' --export-dir '/user/hive/warehouse/job.db/fx_result';

28.查看mysql里面的表是否有数据

29.利用sqoop将hive数据导入到mysql:
sqoop export --connect "jdbc:mysql://localhost:3306/test?characterEncoding=UTF-8" --username root --password 123456 --table kf_result --fields-terminated-by '\001' --export-dir '/user/hive/warehouse/job.db/kf_result';
30.分别查看mysql里面的数据:

条形图如下:
代码如下:
# coding=gbk
import re
from pyecharts import options as opts
from pyecharts.charts import Bar
from pymongo import MongoClient
import pandas as pd
import numpy as np
post_list=["数据分析", "大数据开发工程师", "数据采集"]
avg_list = [12019.00269541779, 18243.627450980395, 9613.38028169014]
max_list = [50000.0 , 130000.0, 40000.0 ]
min_list = [833.3333333333334, 1500.0, 1500.0]
bar = (Bar(init_opts=opts.InitOpts(width="1600px", height="900px"),).set_global_opts(# 设置标题信息title_opts=opts.TitleOpts(title="行业薪资", subtitle="单位  元/月"),# 设置X轴倾斜值xaxis_opts=opts.AxisOpts(axislabel_opts={"rotate": 30}),# 显示工具箱toolbox_opts=opts.ToolboxOpts())# 关联数据.add_xaxis(post_list)  # 确定x轴上要显示的内容# 确定y轴上要显示的内容.add_yaxis('平均工资', avg_list).add_yaxis('最高工资', max_list).add_yaxis('最低工资', min_list)
)
bar.render("行业薪资.html")
2.分析“数据分析”、“大数据开发工程师”、“数据采集”等大数据相关岗位在成都、北京、上海、广州、深圳的岗位数,并做饼图将结果展示出来。
1.分别查询数据分析在成都、北京、上海、广州、深圳的岗位数
create table fxcd as select count(*) cd from job where position_name like '%数据分析%' and work_place like '%成都%';

分别创建表,fxcd,fxbj,fxgz,fxsh,求出数据分析在成都、北京、广州、上海、深圳的岗位数
create table fxbj as select count(*) bj from job where position_name like '%数据分析%' and work_place like '%北京%';create table fxgz as select count(*) gz from job where position_name like '%数据分析%' and work_place like '%广州%';create table fxsh as select count(*) sh from job where position_name like '%数据分析%' and work_place like '%上海%';create table fxsz as select count(*) sz from job where position_name like '%数据分析%' and work_place like '%深圳%';
把上面标的数据放在一个表中
insert into fxsh select * from fxgz;
insert into fxsz select * from fxgz;
insert into fxcd select * from fxgz;
insert into fxbj select * from fxgz;

2.饼图如下:
代码如下:
import pandas as pd
%matplotlib inline
import matplotlib.pyplot as plt
plt.rcParams['font.sans-serif']=['SimHei']
plt.rcParams['axes.unicode_minus']=False
sd = [42,97,245,187,136]
labels = ['成都','北京','上海','广州','深圳']plt.pie(x=sd,labels=labels,autopct='%.1f%%')
plt.title("数据分析")
plt.show()

分别创建表,cjcd,cjbj,cjgz,cjsh,求出数据分析在成都、北京、广州、上海、深圳的岗位数
create table cjcd as select count(*) cd from job where position_name like '%数据分析%' and work_place like '%成都%';create table cjbj as select count(*) bj from job where position_name like '%数据采集%' and work_place like '%北京%';create table cjgz as select count(*) gz from job where position_name like '%数据采集%' and work_place like '%广州%';create table cjsh as select count(*) sh from job where position_name like '%数据采集%' and work_place like '%上海%';create table cjsz as select count(*) sz from job where position_name like '%数据采集%' and work_place like '%深圳%';
查看mysql里面的表

分别创建表,kfcd,kfbj,kfgz,kfsh,求出数据开发在成都、北京、广州、上海、深圳的岗位数
create table kfcd as select count(*) cd from job where position_name like '%数据分析%' and work_place like '%成都%';create table kfbj as select count(*) bj from job where position_name like '%数据采集%' and work_place like '%北京%';create table kfgz as select count(*) gz from job where position_name like '%数据采集%' and work_place like '%广州%';create table kfsh as select count(*) sh from job where position_name like '%数据采集%' and work_place like '%上海%';create table kfsz as select count(*) sz from job where position_name like '%数据采集%' and work_place like '%深圳%';
3.数据采集饼图:
代码如下:
import pandas as pd
%matplotlib inline
import matplotlib.pyplot as plt
plt.rcParams['font.sans-serif']=['SimHei']
plt.rcParams['axes.unicode_minus']=False
sd = [42,25,22,12,16]
labels = ['成都','北京','上海','广州','深圳']plt.pie(x=sd,labels=labels,autopct='%.1f%%')
plt.title("数据采集")
plt.show()

4.数据开发,mysql里面的结果如下

5.数据开发饼图如下:
代码如下:
import pandas as pd
%matplotlib inline
import matplotlib.pyplot as plt
plt.rcParams['font.sans-serif']=['SimHei']
plt.rcParams['axes.unicode_minus']=False
sd = [42,25,22,12,16]
labels = ['成都','北京','上海','广州','深圳']plt.pie(x=sd,labels=labels,autopct='%.1f%%')
plt.title("数据开发")
plt.show()

6.在mysql中创建相应的表


利用sqoop将hive数据导出到mysql
sqoop export --connect "jdbc:mysql://localhost:3306/test?chaocalhost:3306/test?characterEncoding=UTF-8" --username root --password 123456 --table kfbj --fields-terminated-by '\001' --export-dir '/user/hive/warehouse/job.db/kfbj';
3、分析大数据相关岗位1-3年工作经验的薪资水平(平均工资、最高工资、最低工资),并做出条形图展示出来;
(1).先创建一个表查询position_name是大数据岗位的信息,里面有work_salary,work_experience字段
create table sj12 as select position_name,work_salary,work_experience from job8 where position_name like '%大数据%';(2).在创建一个表,查询里面工作经验1-3年的模糊查询
create table sj13 as select work_salary,work_experience from sj13 where work_experience like '%1年经验%' or work_experience like '%2年经验%' or work_experience like '%3年经验%' or work_experience like '%1-2年经验%' or work_experience like '%1-3年经验%';
(3)再创建一个表用来存放work_salary字段
create table sj14 as select work_salary from sj13;(4)去掉里面的work_salary让里面只有数字
create table sj15 as select regexp_replace(work_salary,'"work_salary"','')as work_salary from sj14;(5)效果图如下:

create table sj15 as select regexp_replace(work_salary,'"','')as work_salary from sj14;create table sj16 as select regexp_replace(work_salary,'work_salary:','')as work_salary from sj14;
(6)去掉数据里面的空值
insert overwrite table sj14 select * from sj14 where work_salary is not null;
(7)最后饼图:
代码如下:
# coding=gbk
import re
from pyecharts import options as opts
from pyecharts.charts import Bar
from pymongo import MongoClient
import pandas as pd
import numpy as np
post_list=["数据分析", "大数据开发工程师", "数据采集"]
avg_list = [0.96, 1.28, 1.10]
max_list = [2.5, 6, 1.2 ]
min_list = [1.2, 1, 1]
bar = (Bar(init_opts=opts.InitOpts(width="1600px", height="900px"),).set_global_opts(# 设置标题信息title_opts=opts.TitleOpts(title="行业薪资", subtitle="单位  万元/月"),# 设置X轴倾斜值xaxis_opts=opts.AxisOpts(axislabel_opts={"rotate": 30}),# 显示工具箱toolbox_opts=opts.ToolboxOpts())# 关联数据.add_xaxis(post_list)  # 确定x轴上要显示的内容# 确定y轴上要显示的内容.add_yaxis('平均工资', avg_list).add_yaxis('最高工资', max_list).add_yaxis('最低工资', min_list)
)
bar.render("数据行业薪资.html")
**
(4)分析大数据相关岗位几年需求的走向趋势,并做出折线图展示出来;
**
创建一个表用来存放position_name,release_date
create table tm as select position_name,release_date from job8;
查询大数据相关岗位的信息:
create table tm1 as select * from tm where position_name like '%大数据%';创建一个只有日期的字段的表
create table tm2 as select release_date from tm1;create table tm4 as select regexp_replace(position_name,'"','')as position_name,regexp_replace(release_date,'"','')as release_date from tm1; create table tm5 as select release_date from tm4;去掉release_date:字段
create table tm6 as select regexp_replace(release_date,'release_date:','')as release_date from tm5;
分割后得到月:
create table tm7 as select split(release_date,'-')[0] as release_date from tm6;
再来进行统计每个月有多少:
select release_date,count(*)from tm7 group by release_date;效果图如下:

折线图

(5)在学习过程中遇到到错误,已经解决办法
博客:https://blog.csdn.net/weixin_44701462/article/details/107310856
https://blog.csdn.net/weixin_44701462/article/details/107201005
这篇关于大数据实训(爬取前程无忧利用hive、sqoop分析)的文章就介绍到这儿,希望我们推荐的文章对编程师们有所帮助!


