本文主要是介绍禾赛数据集pandaset使用说明,希望对大家解决编程问题提供一定的参考价值,需要的开发者们随着小编来一起学习吧!
禾赛数据集pandaset使用说明
- 1. pandaset数据集介绍
- 1.1 数据集下载
- 1.2 数据集简介
- 1.3 数据集格式说明
- 2. 数据使用说明
- 2.1 创建一个`DataSet`对象来搜索序列
- 2.2 加载特定的序列
- 2.3 读取点云数据
- 2.4 坐标系转换
- 2.5 获取标签信息
- 2.6 数据展示
- 3. 关于坐标系转换的补充说明——刚体变换
- 4. 四元数转换成旋转矩阵
- 5. pandaset点云数据坐标系转换代码
1. pandaset数据集介绍
1.1 数据集下载
pandaset数据集下载地址:https://scale.com/resources/download/pandaset
pandaset工具包代码地址:https://github.com/scaleapi/pandaset-devkit
下载数据集需要通过表格进行注册,然后会转到包含原始数据和注释的下载页面。
1.2 数据集简介
国内激光雷达制造商禾赛科技与人工智能数据标注平台公司Scale AI联合发布了面向L5级自动驾驶的开源商用数据集——PandaSet数据集。该数据集可用于训练机器学习模型 ,助力自动驾驶的实现。数据集首次同时使用了机械旋转和图像级前向两类激光雷达进行数据采集,输出点云分割结果,并面向科研及商业应用公开。
数据集包括48,000多个摄像头图像和16,000个激光雷达扫描点云图像(超过100个8秒场景)。它还包括每个场景的28个注释和大多数场景的37个语义分割标签。
采集数据车辆为克莱斯勒,传感器套件主要包括1个机械LiDAR,1个固态LiDAR,5个广角摄像头,1个长焦摄像头,板载GPS / IMU。
1.3 数据集格式说明
数据下载解压后,会出现103个以序列命名的文件夹,不同序列代表不同场景下的数据。
每个序列文件夹又包含4个文件夹,分别是annotations,camera,lidar,meta。
00.pkl.gz~79.pkl.gz 分别对应80帧连续帧的数据,
其格式如下:
.
├── LICENSE.txt
├── annotations
│   ├── cuboids
│   │   ├── 00.pkl.gz
│   │   .
│   │   .
│   │   .
│   │   └── 79.pkl.gz
│   └── semseg  // Semantic Segmentation is available for specific scenes
│       ├── 00.pkl.gz
│       .
│       .
│       .
│       ├── 79.pkl.gz
│       └── classes.json
├── camera
│   ├── back_camera
│   │   ├── 00.jpg
│   │   .
│   │   .
│   │   .
│   │   ├── 79.jpg
│   │   ├── intrinsics.json
│   │   ├── poses.json
│   │   └── timestamps.json
│   ├── front_camera
│   │   └── ...
│   ├── front_left_camera
│   │   └── ...
│   ├── front_right_camera
│   │   └── ...
│   ├── left_camera
│   │   └── ...
│   └── right_camera
│       └── ...
├── lidar
│   ├── 00.pkl.gz
│   .
│   .
│   .
│   ├── 79.pkl.gz
│   ├── poses.json
│   └── timestamps.json
└── meta├── gps.json└── timestamps.json
2. 数据使用说明
pandaset提供了加载数据集的工具包pandaset-devkit
安装好工具包后可以直接调用API得到我们想要的数据。
2.1 创建一个DataSet对象来搜索序列
from python.pandaset import DataSetdataset = DataSet('/media/datasets/pandaset')
print(dataset.sequences())
print("序列长度", len(dataset.sequences()))print(dataset.sequences(with_semseg=True))
print("适用于分割的序列长度", len(dataset.sequences(with_semseg=True)))# ===========================================
"""
['122', '080', '149', '054', '045',...]
序列长度 103
['122', '080', '149', '054', '024',...]
适用于分割的序列长度 76
"""
2.2 加载特定的序列
# 在先前返回的列表中选择一个来访问特定序列,这里以002为例
seq002 = dataset['002']
# 将传感器数据和元数据加载到内存中,比较耗时
seq002.load()
# 如果只需要雷达数据和对应标签,可以只使用下面的代码加载序列,节约时间
seq002.load_lidar().load_cuboids()
2.3 读取点云数据
pc0 = seq002.lidar[0]
print(pc0)
index        x             y            z       i              t    d0       -75.131138  -79.331690  3.511804   7.0  1.557540e+09  0
1      -112.588306 -118.666002  1.423499  31.0  1.557540e+09  0
2       -42.085902  -44.384891  0.593491   7.0  1.557540e+09  0
3       -27.329435  -28.795053 -0.403781   0.0  1.557540e+09  0
4        -6.196208   -6.621082  1.130009   3.0  1.557540e+09  0...         ...       ...   ...           ... ..
166763   27.670526   17.159726  3.778677  25.0  1.557540e+09  1
166764   27.703935   17.114063  3.780626  27.0  1.557540e+09  1
166765   27.560664   16.955518  3.767948  18.0  1.557540e+09  1
166766   27.384433   16.783824  3.752670  22.0  1.557540e+09  1
166767   27.228821   16.626038  3.739154  20.0  1.557540e+09  1
[166768 rows x 6 columns]
需要注意的是
pandaset使用两种雷达收集数据,一种是360°旋转的雷达pandar64,另外一种是固定朝前的雷达pandarGT。这里的点云来自两个雷达的数据。如果单独选择一个传感器的数据,可以使用set_sensor方法区别两个传感器的数据。
pc0 = s002.lidar[0]
print(pc0.shape)
# (166768, 6)
# 这里的0表示360° LiDAR
s002.lidar.set_sensor(0)  # set to include only mechanical 360° LiDAR
# 这里的0表示第0帧的数据
pc0_sensor0 = s002.lidar[0]
print(pc0_sensor0.shape)
# (106169, 6)
s002.lidar.set_sensor(1)  # set to include only front-facing LiDAR
pc0_sensor1 = s002.lidar[0]
print(pc0_sensor1.shape)
# (60599, 6)
2.4 坐标系转换
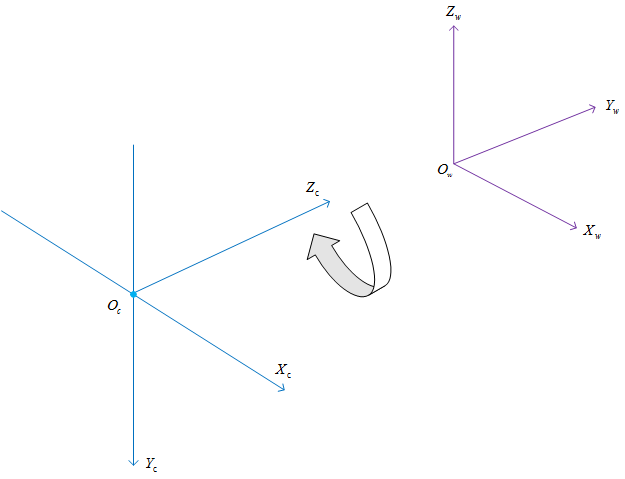
上面所得到的 LiDAR 点是存储在世界坐标系中,下图为360°LiDAR中某一帧的数据,坐标原点为世界坐标系中的原点位置,从图中可以看出,点云中存储的位置坐标信息xyz是基于该坐标原点的位置,而我们想得到的是基于 LiDAR 坐标系(下图中间部分所画的坐标系)的位置信息,因此需要将加载到的点云数据进行处理。

除了LiDAR点之外,lidar属性还针对记录的每个LiDAR帧保留lidar.poses属性,即世界坐标系中的传感器姿态。
# 序列002中第15帧的传感器姿态
pose = seq002.lidar.poses
print(pose[15])
"""
{'position': {'x': 0.40108437325812535, 'y': 10.644695031495647, 'z': 0.024284914159960855},
'heading': {'w': 0.9995436171415057, 'x': -0.00202975597147578, 'y': 0.008319329500030677, 'z': -0.028969402462612804}}
"""
我们可以利用lidar.poses进行坐标系转换
import python.pandaset as pandaset
from python.pandaset import geometry# load dataset
dataset = pandaset.DataSet("/media/datasets/pandaset")
seq002 = dataset["002"]
seq002.load_lidar().load_semseg()seq_idx = 40
# get Pandar64 points
seq002.lidar.set_sensor(0)
pandar64_points = seq002.lidar[seq_idx].to_numpy()pc0 = seq002.lidar[0].to_numpy()
poses = seq002.lidar.poses[seq_idx]
# ego_pandar64_points中所存储的坐标信息即为转换后的坐标信息
ego_pandar64_points = geometry.lidar_points_to_ego(pandar64_points[:, :3], poses)
2.5 获取标签信息
获取方式和点云数据类似,采用 seq002.cuboids方法
cuboids0 = seq002.cuboids[0]  # Returns the cuboid annotations for the first LiDAR frame in the sequence
print(cuboids0.columns)
"""
Index(['uuid', 'label', 'yaw', 'stationary', 'camera_used', 'position.x','position.y', 'position.z', 'dimensions.x', 'dimensions.y','dimensions.z', 'attributes.object_motion', 'cuboids.sibling_id','cuboids.sensor_id', 'attributes.rider_status','attributes.pedestrian_behavior', 'attributes.pedestrian_age'],dtype='object')"""
cuboids0 = seq002.cuboids[0]
for i, row in cuboids0.iterrows():print(row)break
"""
uuid                              33d21162-44d7-40c5-aa77-b53b91ca2bf7
label                                                                    Car
yaw                                                               -0.0541471
stationary                                                         False
camera_used                                                      4
position.x                                                        -1.222
position.y                                                       -23.322
position.z                                                           0.42
dimensions.x                                                   1.869
dimensions.y                                                    4.09
dimensions.z                                                   1.498
attributes.object_motion                         Moving
cuboids.sibling_id                                             -
cuboids.sensor_id                                             -1
attributes.pedestrian_behavior                  NaN
attributes.pedestrian_age                             NaN
attributes.rider_status                                    NaN
Name: 0, dtype: object
"""
标签含义说明:
- uuid: str
Unique identifier for an object. If object is tracked within the sequence, the uuid stays the same on every frame. - label: str
Contains name of object class associated with drawn cuboid. - yaw: str
Rotation of cuboid around the z-axis. Given in radians from which the cuboid is rotated along the z-axis. 0 radians is equivalent to the direction of the vector (0, 1, 0). The vector points at the length-side. Rotation happens counter-clockwise, i.e., PI/2 is pointing in the same direction as the vector (-1, 0, 0). - stationary: bool
True if object is stationary in the whole scene, e.g., a parked car or traffic light. Otherwise False. - camera_used: int
Reference to the camera which was used to validate cuboid position in projection. If no camera was explicitly used, value is set to -1. - position.x: float
Position of the cuboid expressed as the center of the cuboid. Value is in world-coordinate system. - position.y: float
Position of the cuboid expressed as the center of the cuboid. Value is in world-coordinate system. - position.z: float
Position of the cuboid expressed as the center of the cuboid. Value is in world-coordinate system. - dimensions.x: float
The dimensions of the cuboid based on the world dimensions. Width of the cuboid from left to right. - dimensions.y: float
The dimensions of the cuboid based on the world dimensions. Length of the cuboid from front to back. - dimensions.z: float
The dimensions of the cuboid based on the world dimensions. Height of the cuboid from top to bottom. - attributes.object_motion: str
Values are Parked, Stopped or Moving.
Set for cuboids with label values in
Car
Pickup Truck
Medium-sized Truck
Semi-truck
Towed Object
Motorcycle
Other Vehicle - Construction Vehicle
Other Vehicle - Uncommon
Other Vehicle - Pedicab
Emergency Vehicle
Bus
Personal Mobility Device
Motorized Scooter
Bicycle
Train
Trolley
Tram / Subway
attributes.rider_status: str
Values are With Rider or Without Rider.
Set for cuboids with label values in
Motorcycle
Personal Mobility Device
Motorized Scooter
Bicycle
Animals - Other
attributes.pedestrian_behavior: str
Value are Sitting, Lying, Walking or Standing
Set for cuboids with label values in
Pedestrian
Pedestrian with Object - attributes.pedestrian_age: str
Value are Adult or Child (less than ~18 years old)
Set for cuboids with label values in
Pedestrian
Pedestrian with Object - cuboids.sensor_id: int
For the overlap area between mechanical 360° LiDAR and front-facing LiDAR, moving objects received two cuboids to compensate for synchronization differences of both sensors. If cuboid is in this overlapping area and moving, this value is either 0 (mechanical 360° LiDAR) or 1 (front-facing LiDAR). All other cuboids have value -1. - cuboids.sibling_id: str
For cuboids which have cuboids.sensor_id set to 0 or 1: this field stores the uuid of the sibling cuboid, i.e., measuring the same object in the overlap region, but with the other respective sensor.
标签转换代码
需要注意的是:
- 标签信息中包含两个雷达的标签信息,对于重复区域会造成重复框问题,因此需要通过
cuboids.sensor_id属性进行筛选; - 标签信息也需要完成坐标系转换。
- 给定的标签信息dx表示宽,dy表示长,yaw是和Y轴的夹角,为了适应OpenPCDet中的代码结构,我想得到的标签格式是xyzlwh,并且yaw是 雷达坐标系的x坐标轴正方向起始到目标前进方向的角度(弧度),逆时针为正,顺时针为负,范围[-pi,pi),单位弧度。
所以对标签做了一些转换,将下载的数据集转换成可以直接使用的点云数据和标签的完整代码如下:
#!/usr/bin/env python
# coding: utf-8# In[2]:
import math
import osfrom python.pandaset import DataSet
import pyvista as pv
import numpy as np
from matplotlib import cm, pylab
from python.pandaset import geometry
import matplotlib.pyplot as pltfrom scipy.spatial.transform import Rotation as R
import pandasdef cuboids_to_boxes_transform_coord(cuboids: pandas.DataFrame, poses, rotate_yaw=None):str_ret = ''numb_ob = 0sensor1_num = 0for i, row in cuboids.iterrows():# cuboids.sensor_id值为-1,0,1,# 对于两个雷达重复区域的框用0表示(mechanical 360° LiDAR)用1表示 (front-facing LiDAR),其它区域用-1表示sensor_id = row["cuboids.sensor_id"]if sensor_id == 1:sensor1_num += 1continue# if row["label"] == 'Pedestrian with Object':#     ped_with_obj_num += 1#     continue# 坐标偏移# pos_x, pos_y, pos_z, dim_x, dim_y, dim_z, yaw = row["position.x"], row["position.y"], row["position.z"], row["dimensions.x"], row["dimensions.y"],  row["dimensions.z"], row["yaw"]w, l, h = row["dimensions.x"], row["dimensions.y"],  row["dimensions.z"]yaw = row["yaw"] + rotate_yawcenter_xyz = np.array([[row["position.x"], row["position.y"], row["position.z"]]])rotate_corners, _ = geometry.lidar_points_to_ego(center_xyz, poses)x, y, z = rotate_corners[0, 0], rotate_corners[0, 1], rotate_corners[0, 2]while yaw < -np.pi:yaw = np.pi * 2 + yawwhile yaw > np.pi:yaw = yaw - np.pi * 2str = '{} {} {} {} {} {} {} {}\n'.format(row["label"], y, x, z, l, w, h, -yaw)str_ret += strnumb_ob = numb_ob + 1# print("sensor1_num:{}".format(sensor1_num))return str_ret, numb_obdef gen_pandaset_kitti():des_path = '/media/jiangtao/datasets/pandaset数据集/pandaset_datasets_root'pandas_root_path = '/media/jiangtao/datasets/pandaset数据集/pandaset_down'ds = DataSet(pandas_root_path)pkl_dir = os.listdir(pandas_root_path)pkl_dir.sort()for index_nu in pkl_dir:if int(index_nu) < 94:continueprint("index_num =", index_nu)sequence = ds[index_nu]# sequence = sequence.load()sequence.load_lidar().load_cuboids().load_semseg()for i in range(80):print("frame =", i)frame = i# 筛选传感器的点云数据# sequence.lidar.set_sensor(0)# points = sequence.lidar[frame].to_numpy()[..., :3]# points = geometry.lidar_points_to_ego(#     points,#     sequence.lidar.poses[frame]# )# points[..., 2] += -3# 获取点云数据xyzr的信息bin_points = sequence.lidar[frame].to_numpy()[..., :4]# {'position': {'x': 13.831598703698575, 'y': 13.75117108731644, 'z': -0.017840981465058005},# 'heading': {'w': 0.9233120, 'x': 0.00541711, 'y': 0.0162554473, 'z': -0.383668274269}}# 获取每一帧传感器信息poses = sequence.lidar.poses[frame]# 将点云的xyz从世界坐标系下转换成传感器自身坐标系ego_pandar_points, rotate_yaw = geometry.lidar_points_to_ego(bin_points[:, :3], poses)labels, numb_ob = cuboids_to_boxes_transform_coord(sequence.cuboids[frame], poses, rotate_yaw)# if numb_ob > 200:#     print("numb_ob = {} : index_num = {}, frame ={}".format(numb_ob, index_nu, i))pl = bin_points.reshape(-1, 4).astype(np.float32)pl[:, 0] = ego_pandar_points[:, 1]pl[:, 1] = ego_pandar_points[:, 0]pl[:, 2] = ego_pandar_points[:, 2]pl[:, 3] /= 255.filename = str(i).zfill(6)bin_dir = os.path.join(des_path, "{}_bin".format(index_nu).zfill(3))txt_dir = os.path.join(des_path, "{}_txt".format(index_nu).zfill(3))if not os.path.exists(bin_dir):os.mkdir(bin_dir)if not os.path.exists(txt_dir):os.mkdir(txt_dir)velodyne_file_new = os.path.join(bin_dir, filename) + '.bin'pl.tofile(velodyne_file_new)velodyne_file_label_txt = os.path.join(txt_dir, filename) + '.txt'with open(velodyne_file_label_txt, 'w') as f:f.writelines(labels)print('done')if __name__ == '__main__':gen_pandaset_kitti()
2.6 数据展示
根据转换后的点云数据和标签,展示出的效果图如下:

用Second网络结构训练后的预测效果

3. 关于坐标系转换的补充说明——刚体变换
之前提到,我们需要把基于世界坐标系的点云坐标转换成基于雷达坐标系的点云坐标,对于单个雷达这样做的目的是使得我们在设置点云检测范围时是以雷达为中心点去设置的,两个坐标系的转换可以看成是一个刚体变换。
所谓刚体变换就是只改变物体的空间位置(平移)和朝向(旋转),而不改变其形状的变换(一种记忆方法,硬的东西:比如石头,你不能改变他的形状,只能把它旋转或者平移),可用两个变量来描述:正交单位旋转矩阵R,三维平移矢量T.
其实就是一个在世界坐标系依照顺序进行z,y,x的旋转,之后再平移的过程。
旋转矩阵和平移矢量
平移矢量我们很好理解,就是我们沿着各轴方向的平移量。
而旋转矩阵却不是很好理解,在这里我们做一个具体的说明,
旋转一共有三个自由度,即绕x,y,z旋转,
下面以动态图的形式展现绕三个轴旋转的区别:
绕X轴旋转
Roll:横滚

绕Y轴旋转
Pitch: 俯仰

绕Z轴旋转
Yaw: 偏航(航向)

根据旋转角度我们可以在各个方向上将旋转写成矩阵的形式,分别为Rz,Ry,Rx,如下图所示,而旋转矩阵即为三个自由度的旋转矩阵的乘积,即:R=RzRyRx

因此,新坐标矢量 = 旋转矩阵 x 原坐标矢量 + 平移矢量

4. 四元数转换成旋转矩阵
通过上面的介绍,我们知道给出旋转矩阵和偏移量(即雷达外参)就可以进行坐标系转换了,然而有的雷达厂商给出的雷达外参并非是旋转矩阵和偏移量,而是四元数和偏移量,这个时候就需要我们将四元数转换成旋转矩阵。
下面的图介绍了什么是四元数,以及四元数和旋转矩阵的互转公式:

5. pandaset点云数据坐标系转换代码
from python.pandaset import DataSet
import math
import numpy as npdef compose(T, R, Z):n = len(T)R = np.asarray(R)if R.shape != (n,n):raise ValueError('Expecting shape (%d,%d) for rotations' % (n,n))A = np.eye(n+1)ZS = np.diag(Z)A[:n,:n] = np.dot(R, ZS)A[:n,n] = T[:]return Adef quat2mat(q):w, x, y, z = qNq = w*w + x*x + y*y + z*zs = 2.0/NqX = x*sY = y*sZ = z*swX = w*X; wY = w*Y; wZ = w*ZxX = x*X; xY = x*Y; xZ = x*ZyY = y*Y; yZ = y*Z; zZ = z*Zreturn np.array([[ 1.0-(yY+zZ), xY-wZ, xZ+wY ],[ xY+wZ, 1.0-(xX+zZ), yZ-wX ],[ xZ-wY, yZ+wX, 1.0-(xX+yY) ]])def _heading_position_to_mat(heading, position):quat = np.array([heading["w"], heading["x"], heading["y"], heading["z"]])pos = np.array([position["x"], position["y"], position["z"]])transform_matrix = compose(np.array(pos), quat2mat(quat), [1.0, 1.0, 1.0])return transform_matrixdef lidar_points_to_ego(points, lidar_pose):lidar_pose_mat = _heading_position_to_mat(lidar_pose['heading'], lidar_pose['position'])transform_matrix = np.linalg.inv(lidar_pose_mat)return (transform_matrix[:3, :3] @ points.T +  transform_matrix[:3, [3]]).Tif __name__ == '__main__':# 加载序列为002的数据dataset = DataSet('/media/datasets/pandaset')seq002 = dataset['002']seq002.load_lidar().load_cuboids()# get Pandar64 pointsseq002.lidar.set_sensor(0)# 获取第0帧的点云数据points = seq002.lidar[0].to_numpy()[:, :3]# 获取第0帧的雷达传感器姿态,包括偏移量和四元数lidar_pose = seq002.lidar.poses[0]# 得到自身坐标系的点云坐标ego_pandar64_points = lidar_points_to_ego(points, lidar_pose)
参考文章:
https://www.cnblogs.com/21207-iHome/p/6894128.html
https://blog.csdn.net/qq_15029743/article/details/90215104
这篇关于禾赛数据集pandaset使用说明的文章就介绍到这儿,希望我们推荐的文章对编程师们有所帮助!


