本文主要是介绍使用highcharts完成3d饼图,块状凸出,渐变色,希望对大家解决编程问题提供一定的参考价值,需要的开发者们随着小编来一起学习吧!
效果图

在main.js中进行引用
import highcharts from 'highcharts'
import VueHighCharts from 'vue-highcharts'
import highcharts3d from 'highcharts/highcharts-3d'// 引入3d组件
highcharts3d(highcharts)
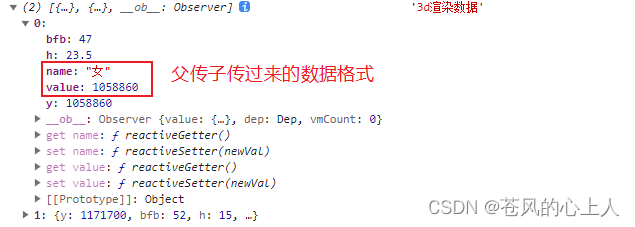
我是写在组件里面的,所以用的父传子
数据格式
组件代码(注释写在代码中,有些配置我也不是很懂,网上找的,发现能用就直接用了)
<!-- 渐变3D饼图样式-->
<template><div style="height: 100%"><div ref="container" style="height: 100%"></div></div>
</template><script>
// import Highcharts from "highcharts/highstock";
import HighchartsMore from "highcharts/highcharts-more";
import HighchartsDrilldown from "highcharts/modules/drilldown";
import Highcharts3D from "highcharts/highcharts-3d";import * as Highcharts from "highcharts";HighchartsMore(Highcharts);
HighchartsDrilldown(Highcharts);
Highcharts3D(Highcharts);let chart = null;
export default {name: "",props: {optionData: {type: Array,default: () => {return [];},},},watch: {optionData: {deep: true,handler() {this.$nextTick(() => {this.dealData();this.init();});},},},data() {return {dataList: [],};},mounted() {this.init();window.addEventListener("resize", () => {//自适应this.init();chart.reflow();});},created() {this.dealData(); //处理父组件传过来的数据},methods: {// 给数据加高度dealData() {let quantity = 0; // 总数//处理数据,给数据加上y和hthis.dataList = this.optionData.map((item, index) => {item["y"] = item["value"];quantity += item["value"];return item;});this.dataList.forEach((item) => {// 计算所占比例item.bfb = parseInt((item.y / quantity) * 100);// 饼图的高度item.h = item.bfb >= 50 ? 15 : item.bfb/2;});// this.dataList[0]['h']=10console.log(this.dataList, "3d渲染数据");},init() {let color1 = ["#00b7f6", "#00baf7"];let color2 = ["#64ecc1", "#0282f0"];// 饼图渐变效果 颜色是上下对应的Highcharts.getOptions().colors = Highcharts.map(Highcharts.getOptions().colors,function(color, index) {return {radialGradient: { cx: 0.5, cy: 0.3, r: 0.7 },stops: [[0, color2[index]],[0.2, color2[index]],[1, color1[index]], // darken],};});if (this.charts) {chart.destroy();}// 饼图凸出部分代码  直接复制即可var each = Highcharts.each,round = Math.round,cos = Math.cos,sin = Math.sin,deg2rad = Math.deg2rad;Highcharts.wrap(Highcharts.seriesTypes.pie.prototype,"translate",function(proceed) {proceed.apply(this, [].slice.call(arguments, 1));// Do not do this if the chart is not 3Dif (!this.chart.is3d()) {return;}var series = this,chart = series.chart,options = chart.options,seriesOptions = series.options,depth = seriesOptions.depth || 0,options3d = options.chart.options3d,alpha = options3d.alpha,beta = options3d.beta,z = seriesOptions.stacking? (seriesOptions.stack || 0) * depth: series._i * depth;z += depth / 2;if (seriesOptions.grouping !== false) {z = 0;}each(series.data, function(point) {var shapeArgs = point.shapeArgs,angle;point.shapeType = "arc3d";var ran = point.options.h;shapeArgs.z = z;shapeArgs.depth = depth * 0.75 + ran;shapeArgs.alpha = alpha;shapeArgs.beta = beta;shapeArgs.center = series.center;shapeArgs.ran = ran;angle = (shapeArgs.end + shapeArgs.start) / 2;point.slicedTranslation = {translateX: round(cos(angle) * seriesOptions.slicedOffset * cos(alpha * deg2rad)),translateY: round(sin(angle) * seriesOptions.slicedOffset * cos(alpha * deg2rad)),};});});(function(H) {H.wrap(Highcharts.SVGRenderer.prototype, "arc3dPath", function(proceed) {// Run original proceed methodvar ret = proceed.apply(this, [].slice.call(arguments, 1));ret.zTop = (ret.zOut + 0.5) / 100;return ret;});})(Highcharts);// 初始化chart = Highcharts.chart(this.$refs.container, {chart: {type: "pie",backgroundColor: null, //去掉背景颜色animation: false,marginTop: 10,// 没有这个events 饼图是向下凸出,这是向上凸出events: {load: function() {var each = Highcharts.each,points = this.series[0].points;each(points, function(p, i) {p.graphic.attr({translateY: -p.shapeArgs.ran,});p.graphic.side1.attr({translateY: -p.shapeArgs.ran,});p.graphic.side2.attr({translateY: -p.shapeArgs.ran,});});},},options3d: {enabled: true,alpha: 55,beta: 0, //图表视图旋转角度viewDistance: 40, //定义图表的浏览长度},spacingTop: 0,spacingLeft: 0,spacingRight: 0,},legend: {align: "right", //程度标的目标地位layout: "horizontal",verticalAlign: "top", //垂直标的目标地位padding: 2,margin: 0,itemStyle: {cursor: "pointer",color: "#FFFFFF",fontWeight: 100,backgroundColor: ["#ccc"],},itemHoverStyle: {color: "#FFFFFF",},},tooltip: {//提示框backgroundColor: "rgba(	248,248,255,0.7)",borderColor: "#3EB6F5",color: "#000",useHTML: true,formatter: function() {let s ='<div style="color: #3C3A3A">' +this.key +":" +this.y +"</div>";return s;},},title: {text: null,},credits: {enabled: false, //去掉右下角水印},plotOptions: {pie: {// 控制饼图的大小// size:"65%",allowPointSelect: false,cursor: "pointer",depth: 15,textShadow: false,softConnector: false,dataLabels: {enabled: true,alignTo: "toPlotEdges",// 文字距离牵引线的上下的位置y: -20,// 这里是标签的引导线connectorShape: function(labelPosition,connectorPosition,options) {var touchingSliceAt = connectorPosition.touchingSliceAt,alignment = labelPosition.alignment,left = 0,right = 0;// console.log(touchingSliceAt,123123);// 设置牵引线的长度if (alignment == "left") {left = labelPosition.x + 1 + this.dataLabel.width;right = labelPosition.x + 2;} else {left = labelPosition.x - 1 - this.dataLabel.width;right = labelPosition.x - 2;}return ["M",left,labelPosition.y,"L",right,labelPosition.y,"L",touchingSliceAt.x,touchingSliceAt.y,];},// 展示的文字formatter: function() {return (this.key +":" +((this.point.value / this.point.total) * 100).toFixed(1) +"%");},distance: 20,style: {color: "#FFFFFF",fontSize: "14px",textOutline: "none",fontWeight: "400",},connectorColor: "white",},states: {inactive: {opacity: 1,size: "150%",},},},},series: [{type: "pie",size: "120%",data: this.dataList, //传入数据},],});},},
};
</script><style lang="scss" scoped></style>
这篇关于使用highcharts完成3d饼图,块状凸出,渐变色的文章就介绍到这儿,希望我们推荐的文章对编程师们有所帮助!


