本文主要是介绍Seurat数据集处理流程,希望对大家解决编程问题提供一定的参考价值,需要的开发者们随着小编来一起学习吧!
多数据集
pancreas数据集
suppressMessages(require(Seurat))
suppressMessages(require(ggplot2))
suppressMessages(require(cowplot))
suppressMessages(require(scater))
suppressMessages(require(scran))
suppressMessages(require(BiocParallel))
suppressMessages(require(BiocNeighbors))
setwd("/Users/xiaokangyu/Desktop/程序学习总结/库学习/Seurat/data/pancreas_v3_file")
pancreas.data <- readRDS(file = "pancreas_expression_matrix.rds")
metadata <- readRDS(file = "pancreas_metadata.rds")
pancreas <- CreateSeuratObject(pancreas.data, meta.data = metadata)
#注意这个和其他的情况是不一样的,这里只有metadata的标注信息的
#之前的数据集只是传入count matrix,而并没有同时传入meta.data# 标准化数据(Filter cells省略了,这个影响不大)
# Normalize and find variable features
pancreas <- NormalizeData(pancreas, verbose = FALSE)
pancreas <- FindVariableFeatures(pancreas, selection.method = "vst", nfeatures = 2000, verbose = FALSE)# Run the standard workflow for visualization and clustering
pancreas <- ScaleData(pancreas, verbose = FALSE)
pancreas <- RunPCA(pancreas, npcs = 30, verbose = FALSE)
pancreas <- RunUMAP(pancreas, reduction = "pca", dims = 1:30)
p1 <- DimPlot(pancreas, reduction = "umap", group.by = "tech")#画batch图
p2 <- DimPlot(pancreas, reduction = "umap", group.by = "celltype", label = TRUE, repel = TRUE) + NoLegend() #画celltype的图
print(p1+p2)
结果如下
 # 单数据集
``
rm(list=ls())
setwd("/Users/xiaokangyu/Desktop/程序学习总结/库学习/Seurat/")
library(Seurat)
library(dplyr)
library(aricode)
## load data (./Seurat/Koh.Rdata)
## Unnormalized data such as raw counts or TPMs
dataname = "./data/Koh.Rdata"
load(dataname)
colnames(label)="celltype"## create Seurat object
pbmc_small <- CreateSeuratObject(data,meta.data = label)## Normalize the count data present in a given assay.
pbmc_small <- NormalizeData(object = pbmc_small)## Identifies features that are outliers on a 'mean variability plot'.
pbmc_small <- FindVariableFeatures(object = pbmc_small)## Scales and centers features in the dataset. If variables are provided in vars.to.regress, they are individually regressed against each feautre, and the resulting residuals are then scaled and centered.
pbmc_small <- ScaleData(object = pbmc_small
)## Run a PCA dimensionality reduction. For details about stored PCA calculation parameters, see PrintPCAParams.
pbmc_small <- RunPCA(object = pbmc_small,pc.genes = pbmc_small@var.genes)
#runPCA和RunUMAP是同时等价地位的。
pbmc_small <- RunUMAP(pbmc_small, reduction = "pca", dims = 1:30)## Randomly permutes a subset of data, and calculates projected PCA scores for these 'random' genes. Then compares the PCA scores for the 'random' genes with the observed PCA scores to determine statistical signifance. End result is a p-value for each gene's association with each principal component.
pbmc_small <- JackStraw(object = pbmc_small)## Constructs a Shared Nearest Neighbor (SNN) Graph for a given dataset.
pbmc_small <- FindNeighbors(pbmc_small)##Clustering
res = FindClusters(object = pbmc_small)
#res$seurat_clusters
#这里需要注意一点,经过FindCluster后赋值的队象变成了res
#pbmc_small还是没有经过处理之前的,因此它没有$seurat_cluster的属性
#但是之前pbmc_small所具有的全部属性,res全部都有
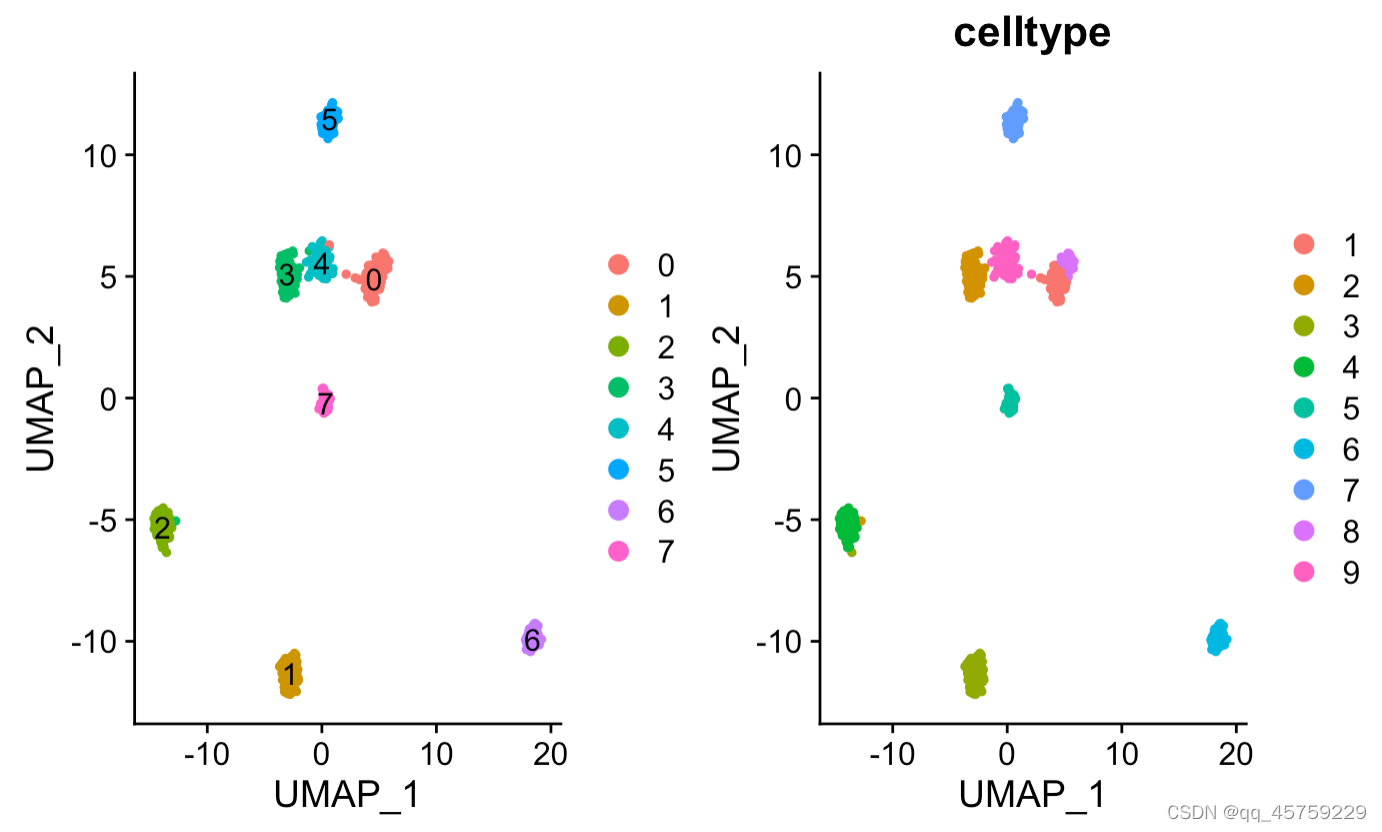
p1 <- DimPlot(res, reduction = "umap",label = T)#画batch图
p2 <- DimPlot(res, reduction = "umap",group.by = "celltype")#画batch图
print(p1+p2)#最终画图可以直接使用+,并排显示
显示label
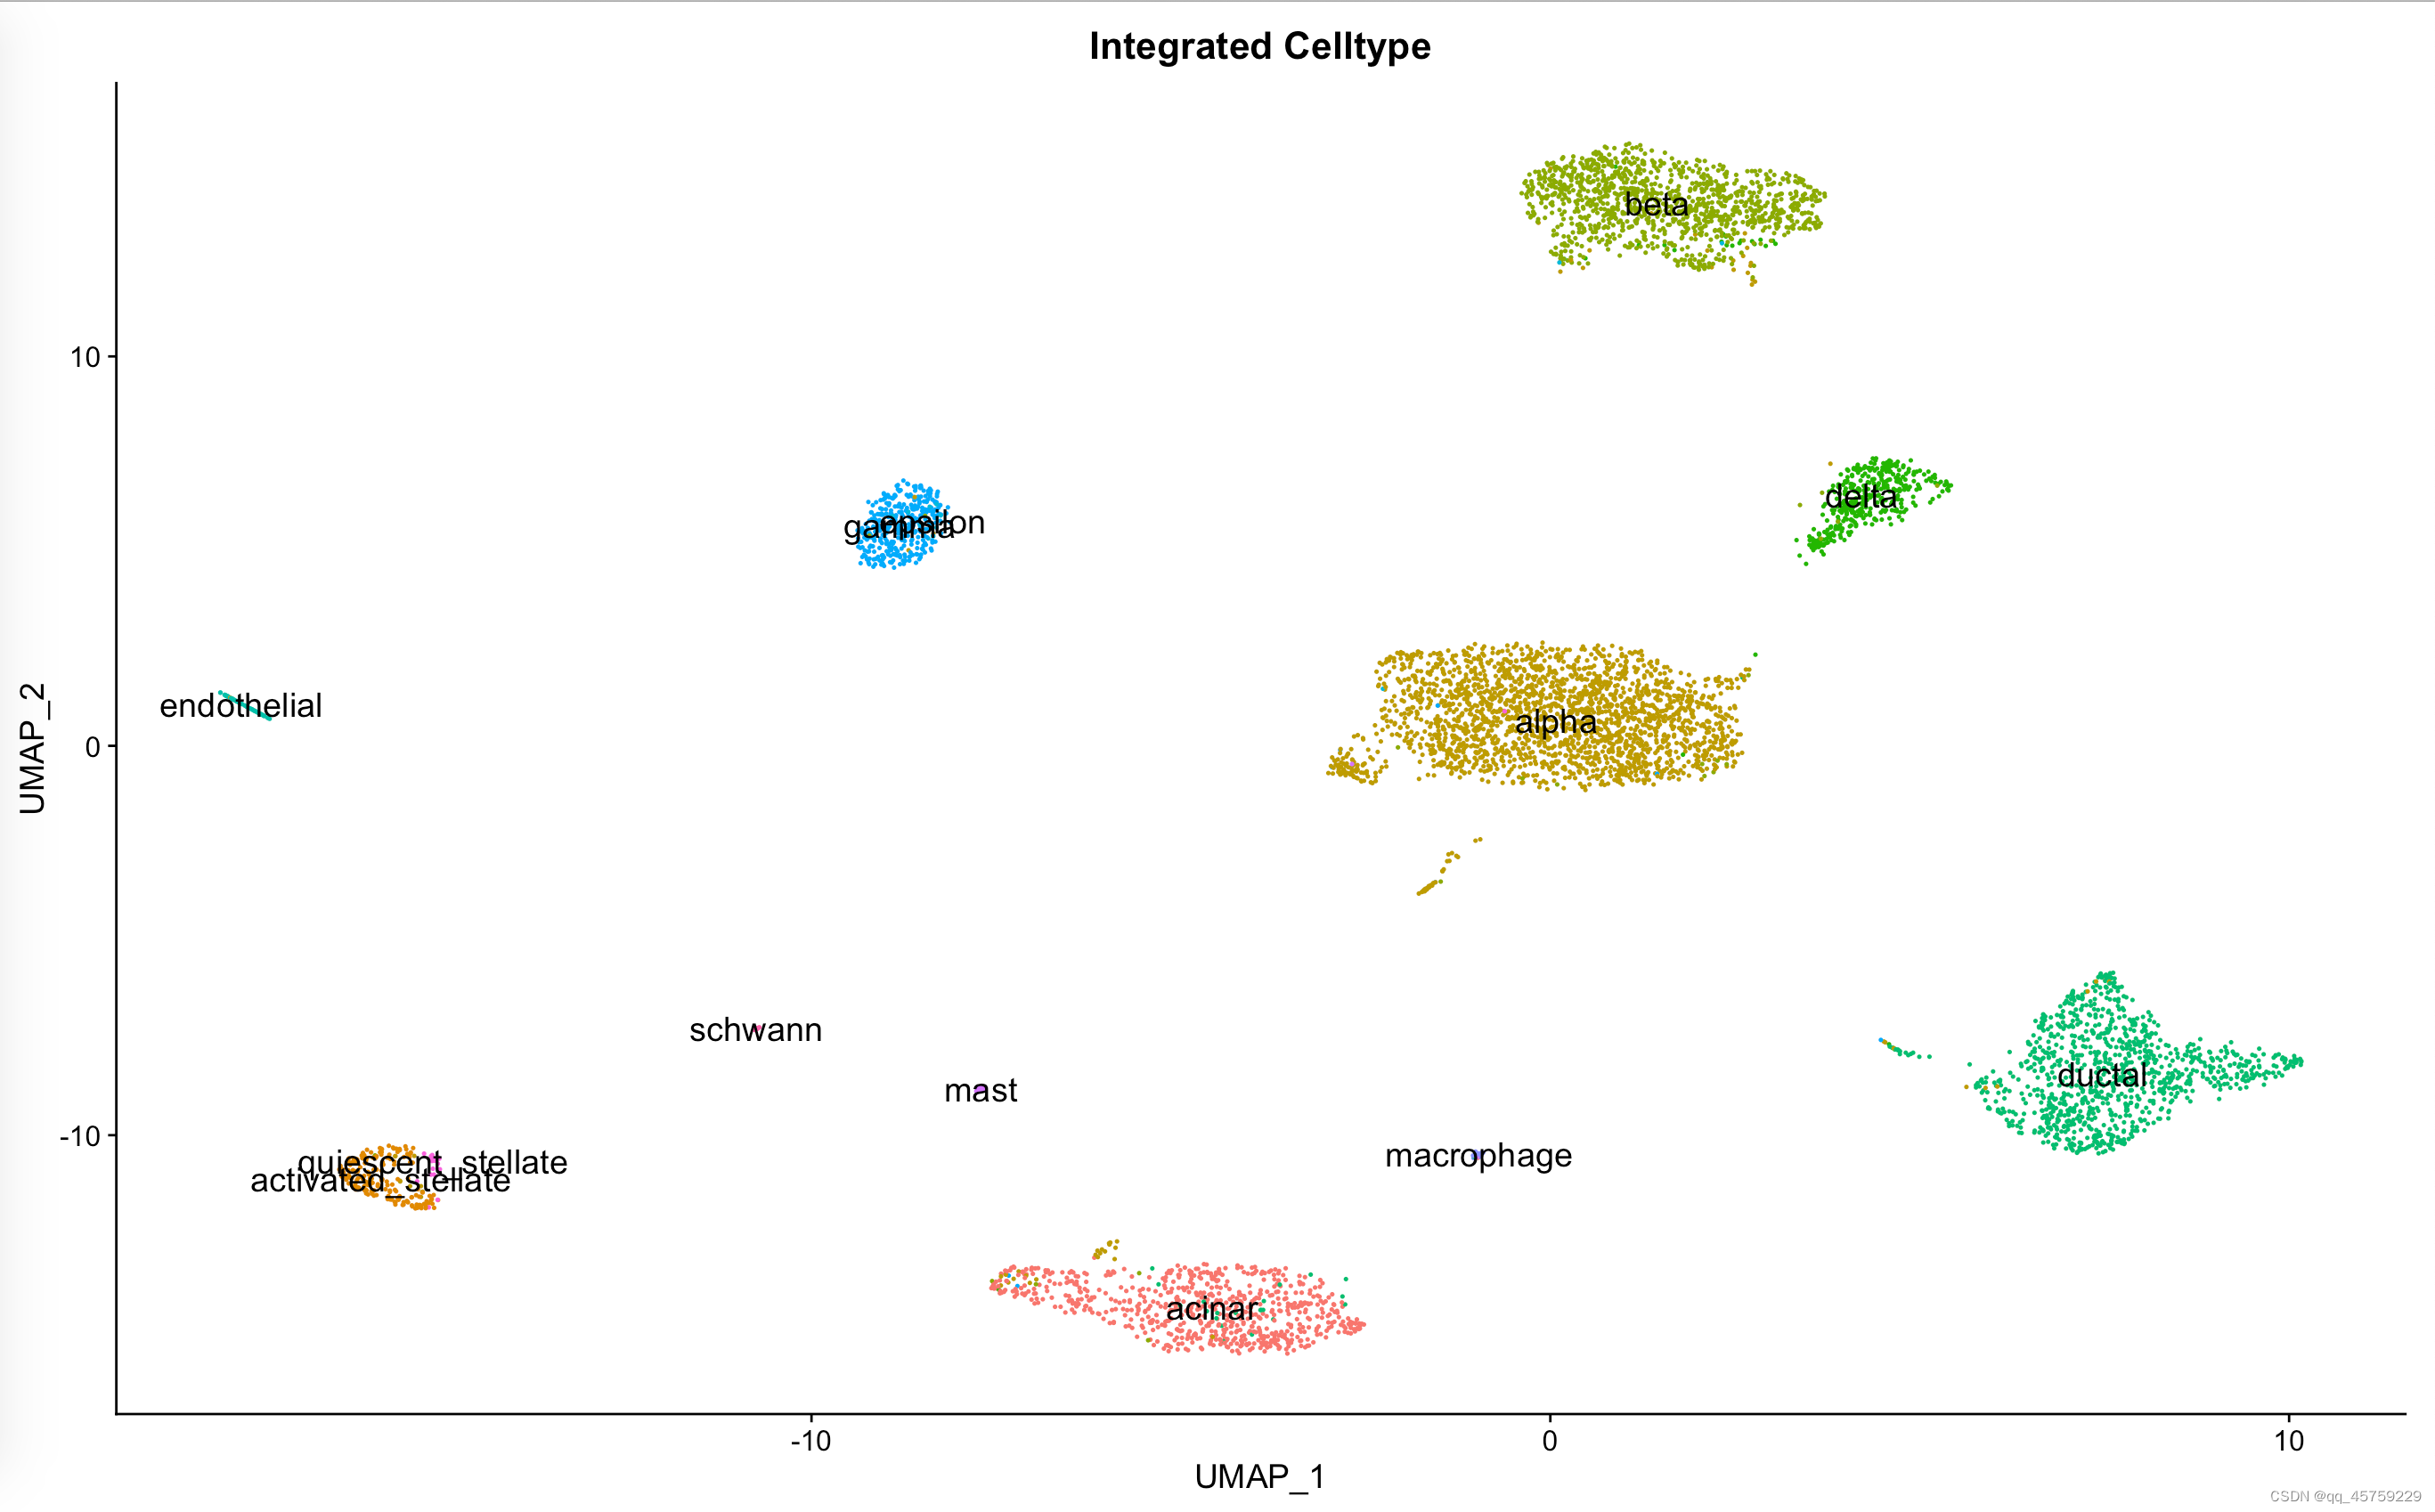
如果想达到和sc.pl.umap(adata,color=["celltype"],legend="on data")
那么在Seurat中需要设置label的参数
pp=DimPlot(data_seurat, reduction = "umap", group.by = "celltype", label.size = 5,label=T)+ggtitle("Integrated Celltype")+NoLegend()
print(pp)
结果如下
Integration
rm(list=ls())
options(future.globals.maxSize = 8000 * 1024^2)
suppressMessages(require(Seurat))
suppressMessages(require(ggplot2))
suppressMessages(require(cowplot))
#suppressMessages(require(scater))
#suppressMessages(require(scran))
#suppressMessages(require(BiocParallel))
#suppressMessages(require(BiocNeighbors))setwd("/home/zhangjingxiao/yxk/Seurat3")
start.time <- Sys.time()
pancreas.data <- readRDS(file = "/DATA2/zhangjingxiao/yxk/dataset/pancreas_v3/pancreas_expression_matrix.rds")
metadata <- readRDS(file = "/DATA2/zhangjingxiao/yxk/dataset/pancreas_v3/pancreas_metadata.rds")
#pancreas <- CreateSeuratObject(pancreas.data, meta.data = metadata)
#注意这个和其他的情况是不一样的,这里只有metadata的标注信息的
#之前的数据集只是传入count matrix,而并没有同时传入meta.data
# 标准化数据(Filter cells省略了,这个影响不大)
# Normalize and find variable features
# pancreas <- NormalizeData(pancreas, verbose = FALSE)
# pancreas <- FindVariableFeatures(pancreas, selection.method = "vst", nfeatures = 2000, verbose = FALSE)
#
# # Run the standard workflow for visualization and clustering
# pancreas <- ScaleData(pancreas, verbose = FALSE)
# pancreas <- RunPCA(pancreas, npcs = 30, verbose = FALSE)
# pancreas <- RunUMAP(pancreas, reduction = "pca", dims = 1:30)
#
# p1 <- DimPlot(pancreas, reduction = "umap", group.by = "tech")#画batch图
# p2 <- DimPlot(pancreas, reduction = "umap", group.by = "celltype", label = TRUE, repel = TRUE) +
#   NoLegend() #画celltype的图
# print(p1+p2)
# # ggsave("vis_pancras.png",plot=p1+p2)print("===================Creating SeuraObject==========")
data_seurat= CreateSeuratObject(pancreas.data, meta.data = metadata)
print("===================Split SeuratOject============")
scRNAlist <- SplitObject(data_seurat, split.by = "tech")
print("===================Normalize SeuratObject=======")
scRNAlist <- lapply(scRNAlist, FUN = function(x) NormalizeData(x,verbose=F))
print("===================Find HVG=====================")
scRNAlist <- lapply(scRNAlist, FUN = function(x) FindVariableFeatures(x,verbose=F))
print("preprecessing done")print(scRNAlist)
data.anchors <- FindIntegrationAnchors(object.list =scRNAlist, dims = 1:20,verbose = F)
data.combined <- IntegrateData(anchorset = data.anchors, dims = 1:20,verbose = F)   DefaultAssay(data.combined) <- "integrated"
################### scale data  =====================
data.combined <- ScaleData(data.combined, verbose = FALSE)
data.combined <- RunPCA(data.combined, npcs = 30, verbose = FALSE)
# t-SNE and Clustering
data.combined <- RunUMAP(data.combined, reduction = "pca", dims = 1:20,verbose=F)p1=DimPlot(data.combined, reduction = "umap", group.by = "tech", label.size = 10)+ggtitle("Integrated Batch")
p2=DimPlot(data.combined, reduction = "umap", group.by = "celltype", label.size = 10)+ggtitle("Integrated Celltype")
p= p1 + p2
print(p1+p2)# adata <- CreateSeuratObject(pancreas.data, meta.data = metadata)
# message('Preprocessing...')
# adata.list <- SplitObject(adata, split.by = "tech")
#
# print(dim(adata)[2])
# if(dim(adata)[2] < 50000){
#   for (i in 1:length(adata.list)) {
#     adata.list[[i]] <- NormalizeData(adata.list[[i]], verbose = FALSE)
#     adata.list[[i]] <- FindVariableFeatures(adata.list[[i]], selection.method = "vst", nfeatures = args$n_top_features, verbose = FALSE)
#   }
#   message('FindIntegrationAnchors...')
#   adata.anchors <- FindIntegrationAnchors(object.list = adata.list, dims = 1:30,verbose =FALSE,k.filter = 30)
#   #     adata.anchors <- FindIntegrationAnchors(object.list = adata.list, dims = 1:30,verbose =FALSE,k.filter = 100)
#
#   message('IntegrateData...')
#   adata.integrated <- IntegrateData(anchorset = adata.anchors, dims = 1:30, verbose = FALSE)
# }else{
#   adata.list <- future_lapply(X = adata.list, FUN = function(x) {
#     x <- NormalizeData(x, verbose = FALSE)
#     x <- FindVariableFeatures(x, nfeatures = args$n_top_features, verbose = FALSE)
#   })
#
#   features <- SelectIntegrationFeatures(object.list = adata.list)
#   adata.list <- future_lapply(X = adata.list, FUN = function(x) {
#     x <- ScaleData(x, features = features, verbose = FALSE)
#     x <- RunPCA(x, features = features, verbose = FALSE)
#   })
#   message('FindIntegrationAnchors...')
#   adata.anchors <- FindIntegrationAnchors(object.list = adata.list, dims = 1:30, verbose =FALSE, reduction = 'rpca', reference = c(1, 2))
#   message('IntegrateData...')
#   adata.integrated <- IntegrateData(anchorset = adata.anchors, dims = 1:30, verbose = FALSE)
# }
#
# if (!file.exists(args$output_path)){
#   dir.create(file.path(args$output_path),recursive = TRUE)
# }
这篇关于Seurat数据集处理流程的文章就介绍到这儿,希望我们推荐的文章对编程师们有所帮助!


