本文主要是介绍【OceanBase DBA早下班系列】—— 性能问题如何 “拍CT“ (一键获取火焰图和扁鹊图),希望对大家解决编程问题提供一定的参考价值,需要的开发者们随着小编来一起学习吧!
1. 前言
最近接连遇到几个客户的环境在排查集群性能问题,总结了一下,直接教大家如何去获取火焰图、扁鹊图(调用关系图),直击要害,就像是内脏的疾病去医院看病,上来先照一个CT,通过分析CT,大概的毛病也就定位的七七八八了。
2. 火焰图/扁鹊图一键收集
2.1. 步骤一:安装部署obdiag
参考文档: OceanBase分布式数据库-海量数据 笔笔算数
安装obdiag并配置被诊断集群信息(~/.obdiag/config.yml),说明:obdiag 是一款25MB大小的针对OceanBase的黑屏命令行的诊断小工具,功能强大,部署简单。
sudo yum install -y yum-utils
sudo yum-config-manager --add-repo https://mirrors.aliyun.com/oceanbase/OceanBase.repo
sudo yum install -y oceanbase-diagnostic-tool
source /usr/local/oceanbase-diagnostic-tool/init.sh# 配置被诊断集群信息
obdiag config -hxx.xx.xx.xx -uroot@sys -Pxxxx -p*****
2.2. 步骤二:一键收集火焰图/扁鹊图
obdiag gather perf收集过程如图:

解压之后的结果
$tree
.
├── flame.data # 火焰图的数据,后面会用到
├── flame.viz
├── sample.data
├── sample.viz # 扁鹊图的数据,后面会用到
└── top.txt
2.3. 步骤三:将火焰图/扁鹊图数据可视化
git clone https://github.com/brendangregg/FlameGraph.git# 将上面采集到的flame.viz数据经过两次处理,就可以火焰图
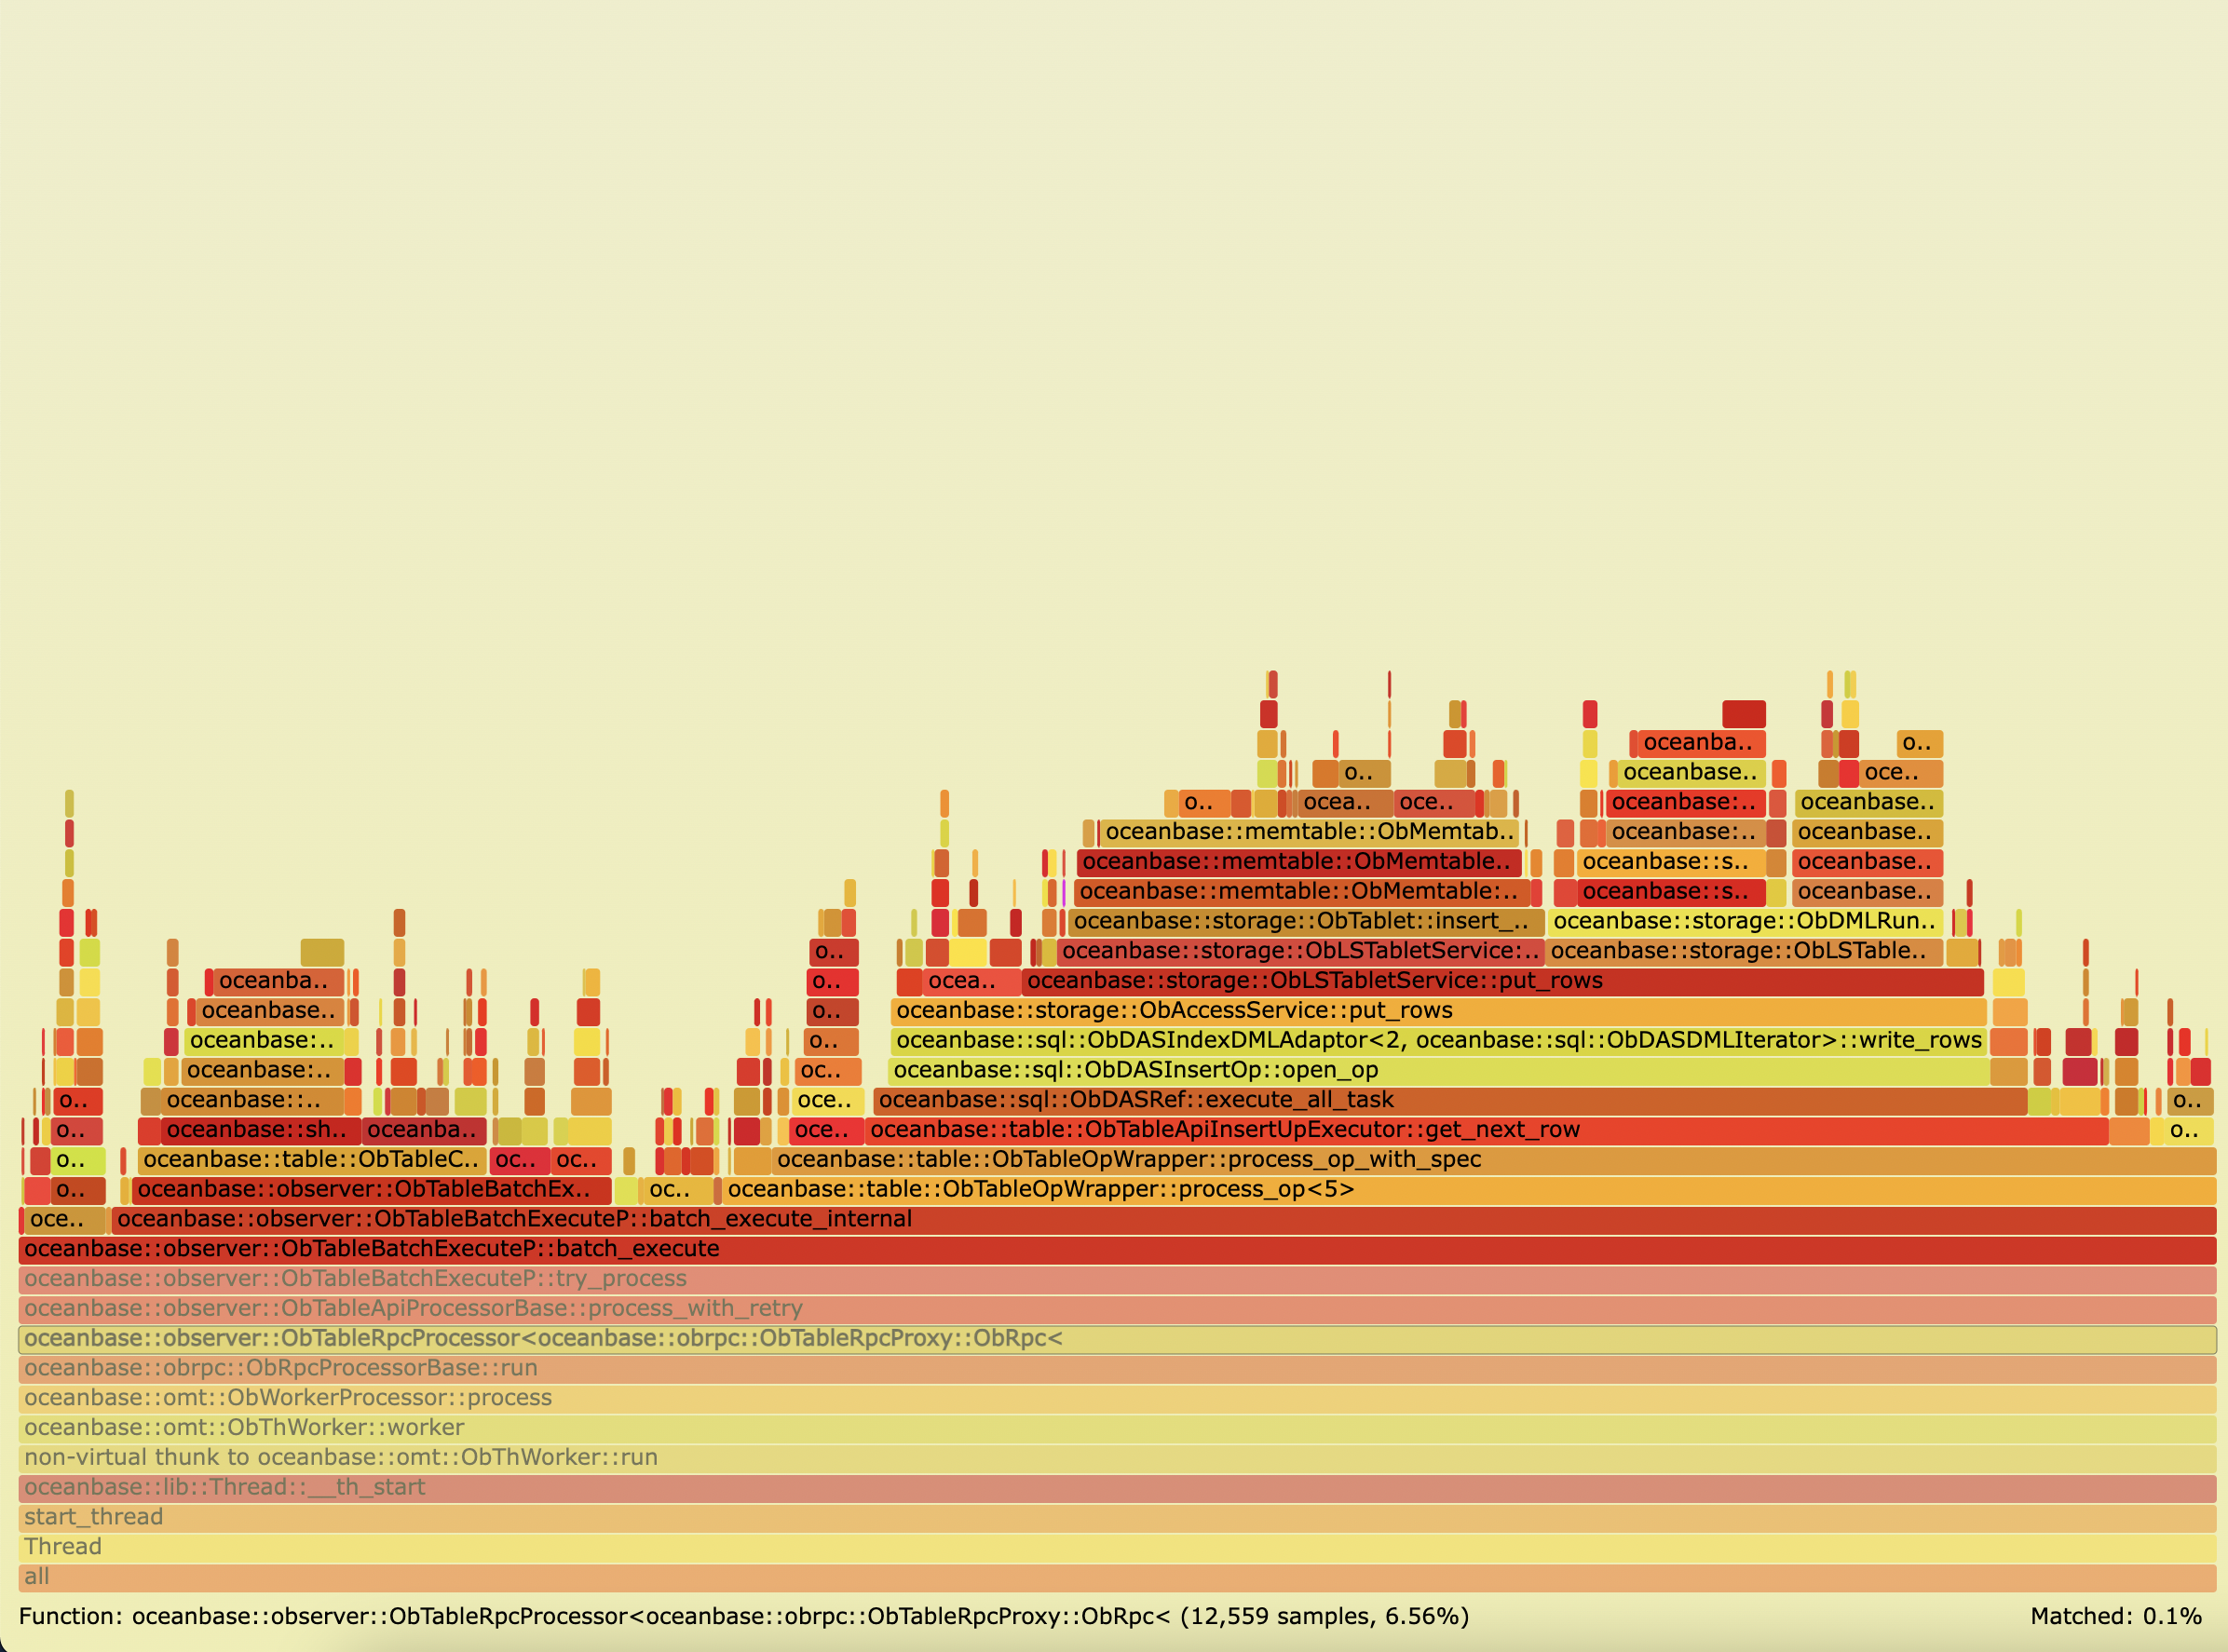
./FlameGraph/stackcollapse-perf.pl flame.viz | ./FlameGraph/flamegraph.pl - > perf.svg
火焰图:
扁鹊图
perfdata2graph.py
#!/usr/bin/pythonimport sys
import os
import subprocess
import datetimeclass Edge:def __init__(self):self.count = 0self.to = Noneself.label = Noneself.penwidth = 1self.weight = 1.self.color = "#000000"class Node:def __init__(self):self.identify = ""self.name = ""self.count = 0self.self_count = 0self.id = Noneself.label = Noneself.color = "#F8F8F8"self.edges = {}def __str__(self):return "id: %s, name: %s, count %s, edges %s" % (self.id, self.name, self.count, len(self.edges))class PerfToGraph:def __init__(self, fmt = "svg", node_drop_pct = 1., edge_drop_pct = None):self.fmt = fmtself.all_nodes = {}self.samples = 1self.s100 = 100.self.node_drop_pct = node_drop_pctself.edge_drop_pct = edge_drop_pctself.next_edge_color = 0if edge_drop_pct is None:self.edge_drop_pct = node_drop_pct / 5.self.node_drop_cnt = 0self.edge_drop_cnt = 0self.colors = [(0.02, "#FAFAF0"),(0.2, "#FAFAD2"),(1.0, "#F9EBB6"),(2.0, "#F9DB9B"),(3.0, "#F8CC7F"),(5.0, "#F7BC63"),(7.0, "#FF8B01"),(9.0, "#FA6F01"),(12.0, "#F55301"),(15.0, "#F03801"),(19.0, "#EB1C01"),(23.0, "#E60001")]self.edge_colors = ["#FF8B01","#EB1C01","#DC92EF","#9653B8","#66B031","#D9CA0C","#BDBDBD","#696969","#113866","#5CBFAC","#1120A8","#960144","#EA52B2"]def convert(self):self.read_stdin()self.formalize()self.output()def set_pen_width(self, e):pct = e.count * 100. / self.samplesif pct > 10:e.penwidth = 3 + min(pct, 100) * 2. / 100elif pct > 1:e.penwidth = 1 + pct * 2. / 10else:e.penwidth = 1def set_edge_weight(self, e):e.weight = e.count * 100. / self.samplesif e.weight > 100:e.weight = 100elif e.weight > 10:e.weight = 10 + e.weight / 10.def set_edge_color(self, e):i = self.next_edge_colorself.next_edge_color += 1e.color = self.edge_colors[i % len(self.edge_colors)];def set_node_color(self, n):v = n.self_count / self.s100for p in self.colors:if v >= p[0]:n.color = p[1]def get_node(self, identify, name):if self.all_nodes.has_key(identify):return self.all_nodes[identify]n = Node()n.identify = identifyn.name = nameself.all_nodes[identify] = nreturn ndef add_edge(self, f, t):if f.edges.has_key(t.identify):e = f.edges[t.identify]e.count += 1else:e = Edge()e.to = te.count = 1f.edges[t.identify] = edef read_stdin(self):# $ escape not needed?cmd = "sed -e 's/<.*>//g' -e 's/ (.*$//' -e 's/+0x.*//g' -e '/^[^\t]/d' -e 's/^\s*//'"sub = subprocess.Popen(cmd, stdout=subprocess.PIPE, shell = True)prev = Noneself.samples = 1for l in sub.stdout:l = l.strip()if (not l) and (not prev):# avoding continous empty linescontinuetmp = l.split(' ')addr = tmp[0]name = (" ".join(tmp[1:])).strip()if '[unknown]' == name:name = addrif not l:addr = 'fake_addr'name = '::ALL::'# we use name to identify nodesn = self.get_node(name, name)if prev == n:continuen.count += 1if prev:self.add_edge(n, prev)prev = nif not l:self.samples += 1prev = Nonedef formalize(self):self.s100 = self.samples / 100.self.node_drop_cnt = self.samples * self.node_drop_pct / 100self.edge_drop_cnt = self.samples * self.edge_drop_pct / 100i = 0;for n in self.all_nodes.values():n.id = "n%s" % (i)i+=1n.self_count = n.count - sum([x.count for x in n.edges.values()])n.label = "%s\\nTotal: %.2f%% | Call: %.2f%%\\nSelf: %.2f%%(%s)" % (n.name.replace("::", "\\n"), n.count/self.s100, (n.count - n.self_count)/self.s100, n.self_count/self.s100, n.self_count)self.set_node_color(n)for e in n.edges.values():e.label = "%.2f%%" % (e.count/self.s100)self.set_pen_width(e)self.set_edge_weight(e)self.set_edge_color(e)def to_dot(self):out = []out.append("""digraph call_graph_for_perf_data {style = "perf.css";node [shape = box, style=filled ];""")out.append('note [ label = "%s\\nTotal samples: %d\\nDrop nodes with <= %.2f%%(%d)\\nDrop edges with <= %.2f%%(%d)", fillcolor="#00AFFF" ];' % (datetime.datetime.now().strftime('%Y-%m-%d %H:%M:%S'), self.samples, self.node_drop_pct, int(self.node_drop_cnt), self.edge_drop_pct, int(self.edge_drop_cnt)))for n in self.all_nodes.values():if n.count <= self.node_drop_cnt:continueout.append('%s [ label = "%s", tooltip = "%s", fillcolor="%s"];' % (n.id, n.label, n.name, n.color))for n in self.all_nodes.values():if n.count <= self.node_drop_cnt:continuefor e in n.edges.values():if e.count <= self.edge_drop_cnt or e.to.count <= self.node_drop_cnt:continuetip = 'edgetooltip = "%s ==> %s", labeltooltip = "%s ==> %s"' % (n.name, e.to.name, n.name, e.to.name)out.append('%s -> %s [ penwidth = %.2f, weight = %f, color = "%s", label = "%s", fontcolor = "%s", %s ];' % (n.id, e.to.id, e.penwidth, e.weight, e.color, e.label, e.color, tip))out.append("}")return "\n".join(out)def output(self):if "dot" == self.fmt:print self.to_dot()elif "svg" == self.fmt:cmd = "dot -T svg"sub = subprocess.Popen(cmd, stdin=subprocess.PIPE, shell = True)dot = self.to_dot()sub.communicate(input = dot)elif "top" == self.fmt:try:for n in sorted(self.all_nodes.values(), key = lambda n : n.self_count, reverse = True):print "%s %.2f%%" % (n.name, n.self_count/self.s100)except:passif __name__ == "__main__":support_fmt = { "svg" : None, "dot" : None, "top" : None }if len(sys.argv) < 2 or (not support_fmt.has_key(sys.argv[1])):print "%s dot/svg/top [node_drop_perent] [edge_drop_percent]" % (sys.argv[0])sys.exit(1)fmt = sys.argv[1]nd_pct = len(sys.argv) > 2 and float(sys.argv[2]) or 1.0ed_pct = len(sys.argv) > 3 and float(sys.argv[3]) or 0.2c = PerfToGraph(fmt, nd_pct, ed_pct)c.convert()
# 生成扁鹊图
cat sample.viz | ./perfdata2graph.py svg sample.svg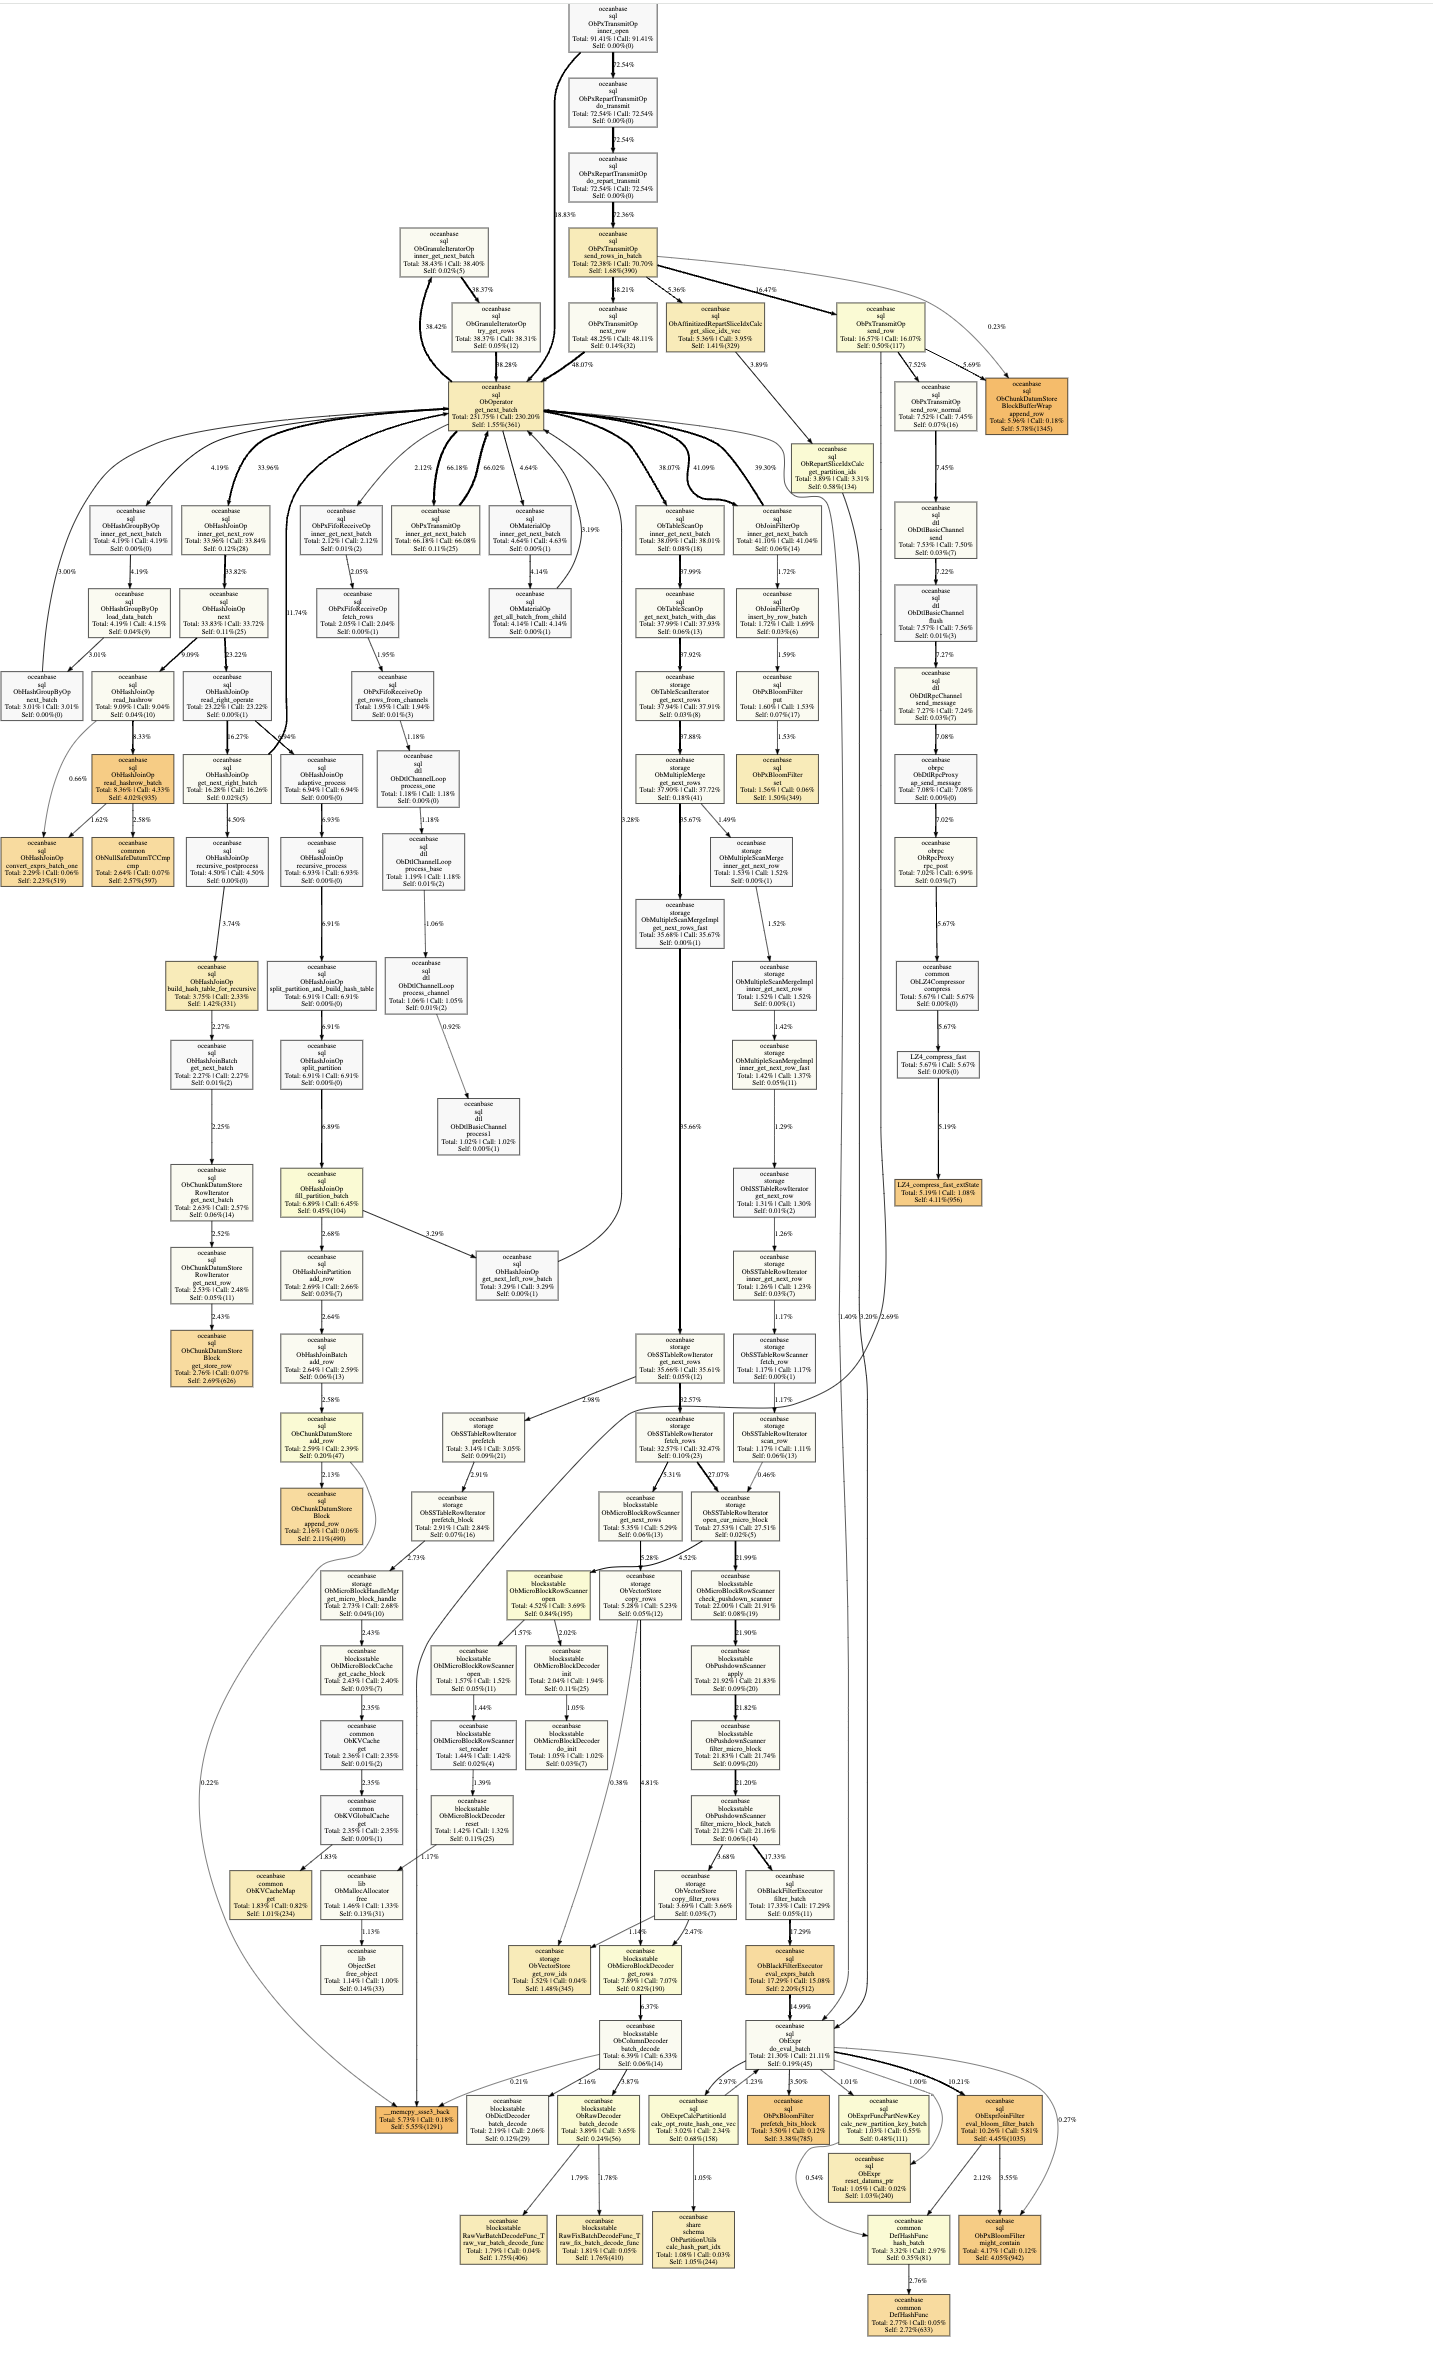
3. obdiag 一键收集火焰图和扁鹊图原理
其实obdiag收集信息是依赖于远端ob节点上的perf工具,所以务必要在ob节点上安装perf工具。相当于obdiag帮你去各个节点上执行了如下命令:
# 注意:-p 后面是进程ID,改成你要 perf 的进程## 生成调用图(扁鹊图)
sudo perf record -e cycles -c 100000000 -p 87741 -g -- sleep 20
sudo perf script -F ip,sym -f > sample.viz## 生成火焰图
sudo perf record -F 99 -p 87741 -g -- sleep 20
sudo perf script > flame.viz
感兴趣的可以通过obdiag gather perf -v 查看详细的obdiag 日志,通过日志你就能大概知道obdiag的执行过程了。
4. 附录
- obdiag 下载地址: OceanBase分布式数据库-海量数据 笔笔算数
- obdiag 官方文档: OceanBase分布式数据库-海量数据 笔笔算数
- obdiag github地址: GitHub - oceanbase/obdiag: obdiag (OceanBase Diagnostic Tool) is designed to help OceanBase users quickly gather necessary information and analyze the root cause of the problem.
- obdiag SIG 营地: 诊断工具 · OceanBase 技术交流
这篇关于【OceanBase DBA早下班系列】—— 性能问题如何 “拍CT“ (一键获取火焰图和扁鹊图)的文章就介绍到这儿,希望我们推荐的文章对编程师们有所帮助!


