本文主要是介绍文献速递:深度学习医学影像心脏疾病检测与诊断--CT中的深度学习用于自动钙评分:使用多个心脏CT和胸部CT协议的验证,希望对大家解决编程问题提供一定的参考价值,需要的开发者们随着小编来一起学习吧!
Title
题目
Deep Learning for Automatic Calcium Scoring in CT:
Validation Using Multiple Cardiac CT and Chest CT Protocols
CT中的深度学习用于自动钙评分:使用多个心脏CT和胸部CT协议的验证
Background
背景
Although several deep learning (DL) calcium scoring methods have achieved excellent performance for specific CT pro tocols, their performance in a range of CT examination types is unknown.
尽管几种深度学习(DL)钙评分方法已经在特定的CT协议中取得了出色的性能,但它们在一系列CT检查类型中的表现尚不清楚。
Method
方法
The study included 7240 participants who underwent various types of nonenhanced CT examinations that in cluded the heart: coronary artery calcium (CAC) scoring CT, diagnostic CT of the chest, PET attenuation correction CT, radiation therapy treatment planning CT, CAC screening CT, and low-dose CT of the chest. CAC and thoracic aorta calcification (TAC) were quantified using a convolutional neural network trained with (a) 1181 low-dose chest CT examinations (baseline), (b) a small set of examinations of the respective type supplemented to the baseline (data specific), and (c) a combination of examinations of all available types (combined). Supplemental training sets contained 199–568 CT images depending on the calcium burden of each population. The DL algorithm performance was evaluated with intraclass correlation coefficients (ICCs) between DL and manual (Agatston) CAC and (volume) TAC scoring and with linearly weighted k values for cardiovascular risk categories (Agatston score; cardiovascular disease risk categories: 0, 1–10, 11–100, 101–400, .400).
该研究包括了7240名参与者,接受了各种类型的非增强CT检查,包括心脏:冠状动脉钙化(CAC)评分CT、胸部诊断CT、PET衰减校正CT、放射治疗计划CT、CAC筛查CT和胸部低剂量CT。使用一个经过训练的卷积神经网络对CAC和胸主动脉钙化(TAC)进行了量化,训练集包括:(a) 1181例低剂量胸部CT检查(基线),(b) 在基线上增补了各自类型的少量检查(数据特定),以及(c) 组合了所有可用类型的检查(综合)。增补训练集根据每个人群的钙负荷而含有199-568张CT图像。DL算法的性能评估采用DL与手动(Agatston)CAC和(体积)TAC评分之间的ICC以及心血管风险类别(Agatston评分;心血管疾病风险类别:0、1-10、11-100、101-400、>400)的线性加权k值
Results
结果
At baseline, the DL algorithm yielded ICCs of 0.79–0.97 for CAC and 0.66–0.98 for TAC across the range of different types of CT examinations. ICCs improved to 0.84–0.99 (CAC) and 0.92–0.99 (TAC) for CT protocol–specific training and to 0.85–0.99 (CAC) and 0.96–0.99 (TAC) for combined training. For assignment of cardiovascular disease risk category, the k value for all test CT scans was 0.90 (95% confidence interval [CI]: 0.89, 0.91) for the baseline training. It increased to 0.92 (95% CI: 0.91, 0.93) for both data-specific and combined training.
在基线情况下,深度学习算法在各种不同类型的CT检查中,钙化量化的ICC为0.79-0.97(CAC)和0.66-0.98(TAC)。对于CT协议特定的训练,ICC提高到0.84-0.99(CAC)和0.92-0.99(TAC),而对于综合训练,ICC则提高到0.85-0.99(CAC)和0.96-0.99(TAC)。对于心血管疾病风险分类的分配,在基线训练中,所有测试CT扫描的k值为0.90(95%置信区间[CI]:0.89,0.91)。对于数据特定和综合训练,k值增加到0.92(95% CI:0.91,0.93)。
Conclusion
结论
A deep learning calcium scoring algorithm for quantification of coronary and thoracic calcium was robust, despite sub stantial differences in CT protocol and variations in subject population. Augmenting the algorithm training with CT protocol–spe cific images further improved algorithm performance.
一个深度学习的钙评分算法,用于量化冠状动脉和胸部钙化,在CT协议和受试者人群方面存在显著差异的情况下表现稳健。通过使用特定于CT协议的图像增强算法训练,进一步提高了算法的性能。
Figure
图
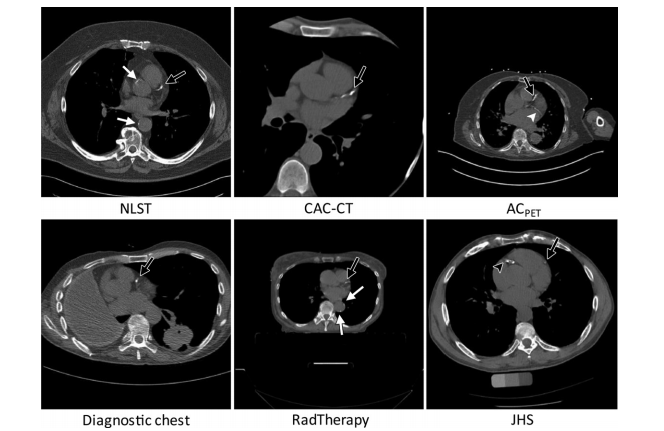
Figure 1: CT images are examples of lung screening CT from the National Lung Screening Trial (NLST), coronary artery calcium scoring CT (CAC-CT), PET attenuation correction (ACPET) CT, diagnostic CT of the chest, radiation therapy treatment planning (RadTherapy) CT, and CT exami nations from the Jackson Heart Study (JHS). Indication of coronary artery calcium in the left anterior descending artery (black arrow), left circumflex artery (white arrowhead), right coronary artery (black arrowhead), and aorta (white arrows).
图1:CT图像示例来自国家肺部筛查试验(NLST),包括肺部筛查CT、冠状动脉钙化评分CT(CAC-CT)、PET衰减校正(ACPET)CT、胸部诊断CT、放射治疗计划(RadTherapy)CT以及来自杰克逊心脏研究(JHS)的CT检查。冠状动脉钙化的指示位于左前降支动脉(黑色箭头)、左回旋支动脉(白色箭头)、右冠状动脉(黑色箭头)和主动脉(白色箭头)处。

Figure 2: Images show architecture of the deep learning calcium scoring algorithm. Algorithm consists of two convolutional neural networks (CNNs). The first CNN has a large field of view and detects candidate calcifications (voxels) on the image and labels them according to their ana tomic location. The second CNN has a smaller field of view and detects true calcified voxels among candidates detected by the first CNN. LAD = left anterior descending artery, LCX = left circumflex artery, RCA = right coronary artery, TAC = thoracic aorta calcification.
图2:图像展示了深度学习钙评分算法的架构。该算法由两个卷积神经网络(CNNs)组成。第一个CNN具有较大的视野,并在图像上检测候选的钙化(体素),并根据其解剖位置对其进行标记。第二个CNN具有较小的视野,并在第一个CNN检测到的候选钙化中检测真实的钙化体素。LAD = 左前降支动脉,LCX = 左回旋支动脉,RCA = 右冠状动脉,TAC = 胸主动脉钙化。
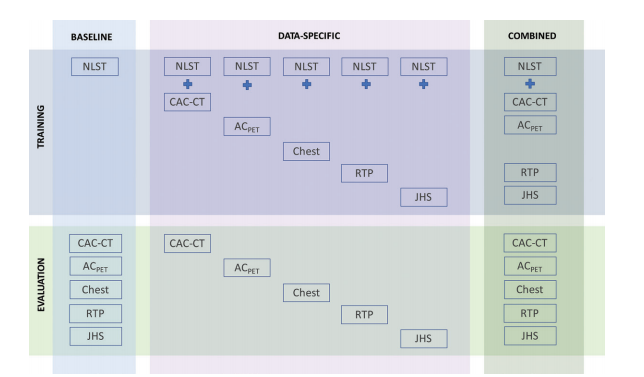
Figure 3: Illustration depicts training and evaluation of baseline, data-specific, and combined algorithms. Baseline algorithm was trained with National Lung Screening Trial (NLST) scans, and its performance was evaluated in each CT protocol type. Five data-specific algorithms were trained, one specifically for each CT protocol type, and evaluated in respective CT type. Combined algorithm was trained with a combination of all available CT protocol types (excluding diagnostic chest CT), and its performance was evaluated in all available CT protocol types. CT types used for training were NLST CT examinations, coronary artery calcium scoring CT (CAC-CT), PET attenuation correction (ACPET) CT, diagnostic chest CT, radiation therapy treatment planning (RTP) CT, and CT examinations from the Jackson Heart Study (JHS).
图3:示意图描述了基线、数据特定和综合算法的训练和评估过程。基线算法是使用国家肺部筛查试验(NLST)扫描进行训练的,并在每种CT协议类型中进行了性能评估。针对每种CT协议类型分别训练了五种数据特定算法,并在相应的CT类型中进行了评估。综合算法是使用所有可用的CT协议类型(不包括诊断胸部CT)进行训练的,并在所有可用的CT协议类型中进行了性能评估。用于训练的CT类型包括NLST CT检查、冠状动脉钙化评分CT(CAC-CT)、PET衰减校正(ACPET)CT、胸部诊断CT、放射治疗计划(RTP)CT以及来自杰克逊心脏研究(JHS)的CT检查。
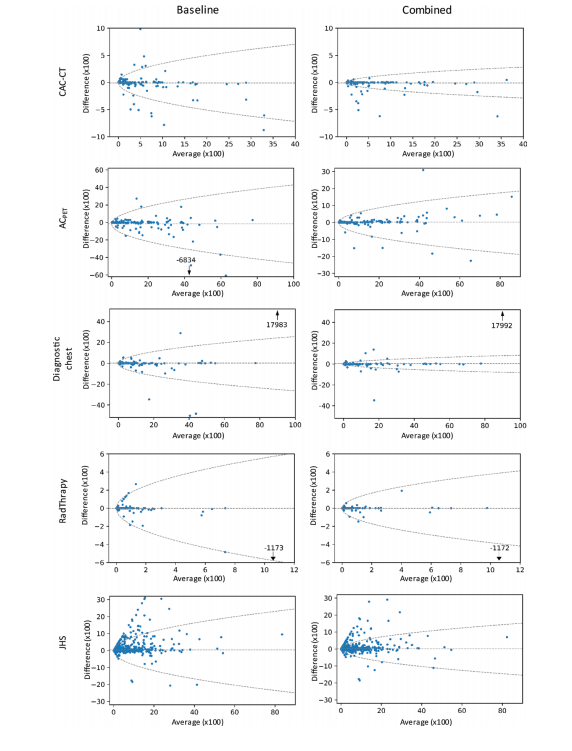
Figure 4: Bland-Altman plots of coronary artery calcium (CAC) Agatston scores with 95% limits of agreement (dashed lines) comparing manual scoring with automatic scoring in CAC CT, PET attenuation correction (ACPET) CT, diagnostic chest, radiation therapy treatment planning (RadTherapy), and CAC research CT from the Jackson Heart Study (JHS). Outliers are indicated by an arrow, with difference given, and 95% limits of agreement are represented by the formula: difference = 61.96 · (p/2)0.5 · (b + a · Mean0.5). For the baseline algorithm coefficients, a and b were 4.6 and 27.1, respectively, for CAC CT; 18.2 and 2178.0, respectively, for ACPET CT; 10.6 and 246.5, respectively, for diagnostic chest CT; 7.2 and 23.2, respectively, for RadTherapy; and 10.6 and 224.3, respectively, for JHS CT examinations. For the combined algorithm, coefficients a and b were 1.8 and 21.9, respectively, for CAC CT; 7.9 and 276.2, respectively, for ACPET CT; 3.4 and 2.7, respectively, for diagnos tic chest CT; 4.8 and 22.4, respectively, for RadTherapy; and 6.6 and 10.8, respectively, for JHS examinations.
图4:Bland-Altman图显示了冠状动脉钙化(CAC)Agatston评分,95%的一致性限(虚线),比较手动评分与CAC CT、PET衰减校正(ACPET)CT、诊断胸部、放射治疗计划(RadTherapy)以及来自杰克逊心脏研究(JHS)的CAC研究CT中的自动评分。异常值由箭头表示,给出了差异,并且95%的一致性限由以下公式表示:差异=61.96·(p/2)0.5·(b+a·Mean0.5)。对于基线算法系数,CAC CT分别为4.6和27.1;ACPET CT分别为18.2和2178.0;诊断胸部CT分别为10.6和246.5;RadTherapy分别为7.2和23.2;JHS CT检查分别为10.6和224.3。对于组合算法,系数a和b分别为1.8和21.9,对于CAC CT;7.9和276.2,对于ACPET CT;3.4和2.7,对于诊断胸部CT;4.8和22.4,对于RadTherapy;6.6和10.8,对于JHS检查。
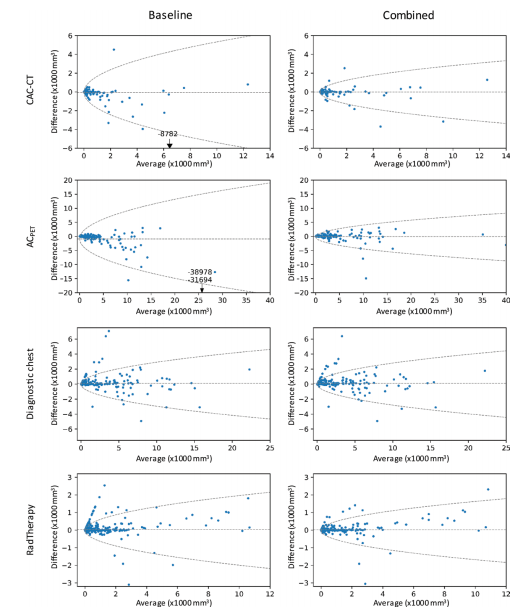
Figure 5: Bland-Altman plots of thoracic aorta calcification volumes (in cubic millimeters) with 95% limits of agreement (dashed lines) comparing manual scoring with automatic scoring in coronary artery calcium (CAC) CT, PET attenuation correction CT (ACPET), clinical chest CT, and radiation therapy treatment planning (RadTherapy) CT. Outliers are indicated by an arrow, with difference given, and 95% limits of agreement are represented by the formula: difference = 61.96 · (p/2)0.5 · (b + a · Mean0.5). For the baseline algorithm, coefficients a and b were 21.9 and 238.3, respectively, for CAC CT; 40.4 and 2859.2, respectively, for ACPET CT, 11.9 and 218.0, respectively, for diagnostic chest CT; and 8.1 and 17.5, respectively, for RadTherapy examinations. For the combined algorithm, coefficients a and b were 11.5 and 220.5, respectively, for CAC CT; 17.2 and 2226.1, respectively, for ACPET CT; 11.4 and 23.9, respectively, for diagnostic chest CT; and 6.7 and 227.1, respectively, for RadTherapy examinations.
图5:Bland-Altman图显示了胸主动脉钙化体积(以立方毫米为单位),95%的一致性限(虚线),比较手动评分与冠状动脉钙化(CAC)CT、PET衰减校正CT(ACPET)、临床胸部CT和放射治疗计划(RadTherapy)CT中的自动评分。异常值由箭头表示,给出了差异,并且95%的一致性限由以下公式表示:差异=61.96·(p/2)0.5·(b+a·Mean0.5)。对于基线算法,系数a和b分别为21.9和238.3,对于CAC CT;分别为40.4和2859.2,对于ACPET CT;分别为11.9和218.0,对于诊断胸部CT;分别为8.1和17.5,对于RadTherapy检查。对于组合算法,系数a和b分别为11.5和220.5,对于CAC CT;分别为17.2和2226.1,对于ACPET CT;分别为11.4和23.9,对于诊断胸部CT;分别为6.7和227.1,对于RadTherapy检查。
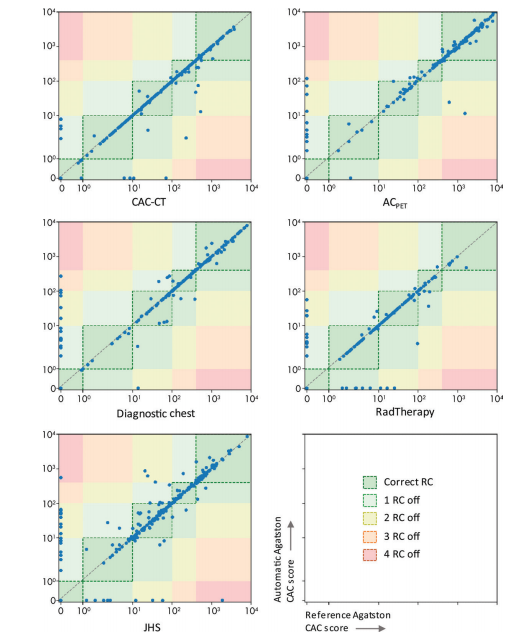
Figure 6: Graphs show Agatston scores calculated automatically with the combined algorithm plotted against manually calculated Agatston scores for scoring in coronary artery calcium (CAC) CT, PET attenuation correction (ACPET) CT, diagnostic CT of chest, radiation therapy treatment planning (RadTherapy), and CAC research CT from the Jackson Heart Study (JHS). Difference between risk categories (RCs) assigned by manual and automatic calcium scoring is indicated by colored blocks. Cardiovascular disease risk categories are as follows: 0, 1–10, 11–100, 101–400, .400. For JHS examinations, random selection of 500 examinations is shown for visualization purposes. Note that scale is log scale.
图6:图表显示了使用组合算法自动计算的Agatston分数与手动计算的Agatston分数之间的关系,用于冠状动脉钙化(CAC)CT、PET衰减校正(ACPET)CT、胸部诊断CT、放射治疗计划(RadTherapy)CT以及来自杰克逊心脏研究(JHS)的CAC研究CT的评分。手动和自动钙评分分配的风险分类之间的差异由彩色块表示。心血管疾病风险分类如下:0、1–10、11–100、101–400、>400。对于JHS检查,随机选择了500个检查进行可视化。请注意,刻度为对数刻度。
Table
表
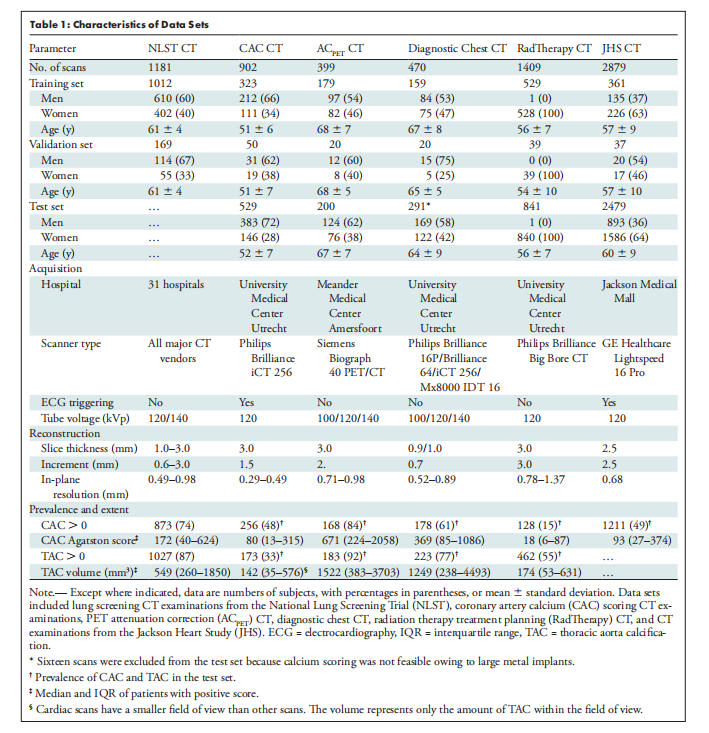
Table 1: Characteristics of Data Sets
表1:数据集特征

Table 2: Volume-wise Performance Evaluation of Baseline, Data-Specific, and Combined Training Networks
表2:基线、数据特定和综合训练网络的体积性能评估
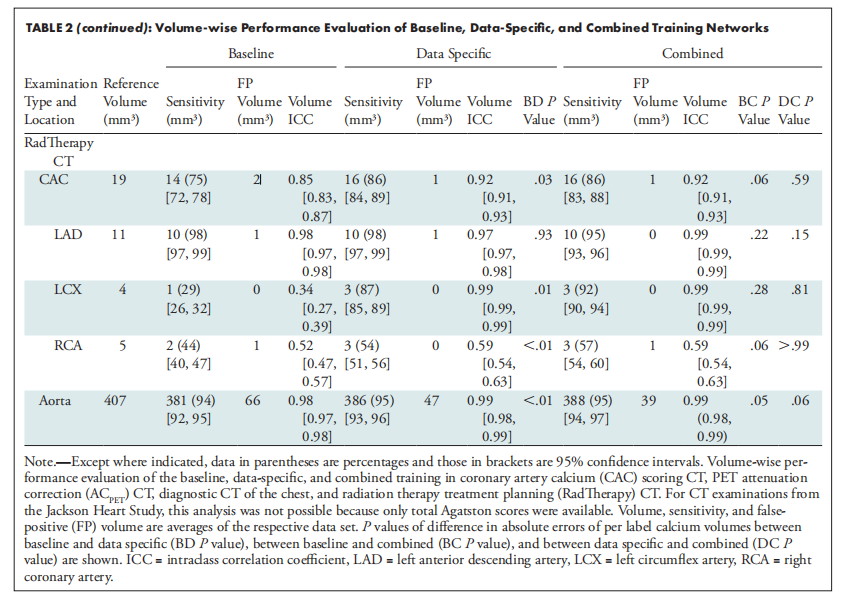
TABLE 2 (continued): Volume-wise Performance Evaluation of Baseline, Data-Specific, and Combined Training Networks
表2(续):基线、数据特定和综合训练网络的体积性能评估
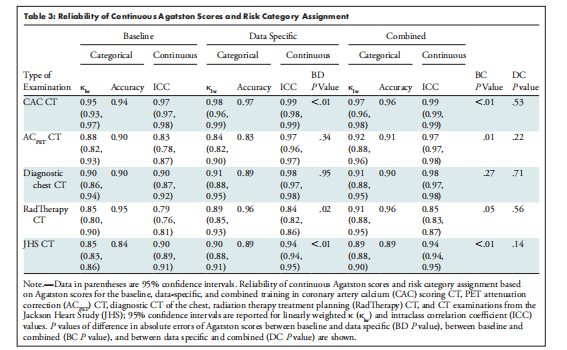
Table 3: Reliability of Continuous Agatston Scores and Risk Category Assignment
表3:连续Agatston分数和风险分类分配的可靠性
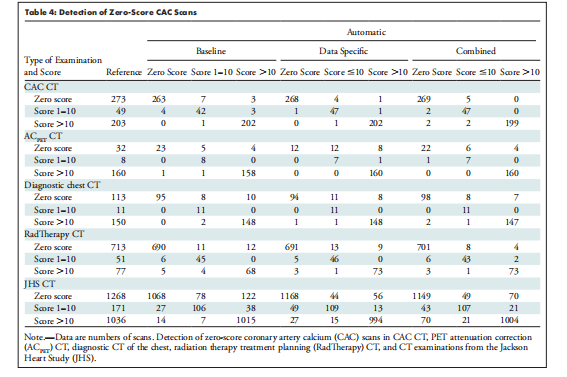
Table 4: Detection of Zero-Score CAC Scans
表4:零分CAC扫描的检测
这篇关于文献速递:深度学习医学影像心脏疾病检测与诊断--CT中的深度学习用于自动钙评分:使用多个心脏CT和胸部CT协议的验证的文章就介绍到这儿,希望我们推荐的文章对编程师们有所帮助!


