本文主要是介绍ComplexHeatmap绘图:注释、图例、热图基础(自备),希望对大家解决编程问题提供一定的参考价值,需要的开发者们随着小编来一起学习吧!
目录
基础介绍
Heatmap绘图基础参数
数据
作图参数
Heatmap Annotations(注释)
基础注释设置
简单注释测试
anno_points散点注释
anno_lines连线注释
anno_barplot条形图
anno_boxplot箱线图
anno_histogram直方图
热图组合
基础组合
进行调整(水平串联)
垂直串联(使用%v%连接)
ComplexHeatmap中文版说明 (pengpengyang94.github.io)
学习ComplexHeatmap复杂热图_complexheatmap km-CSDN博客
ComplexHeatmap绘制热图并进行个性化标注_complexheatmap图例修改-CSDN博客
基础介绍
主要是热图+注释+图例的组合。熟悉这几个基础技能完成各种组合。
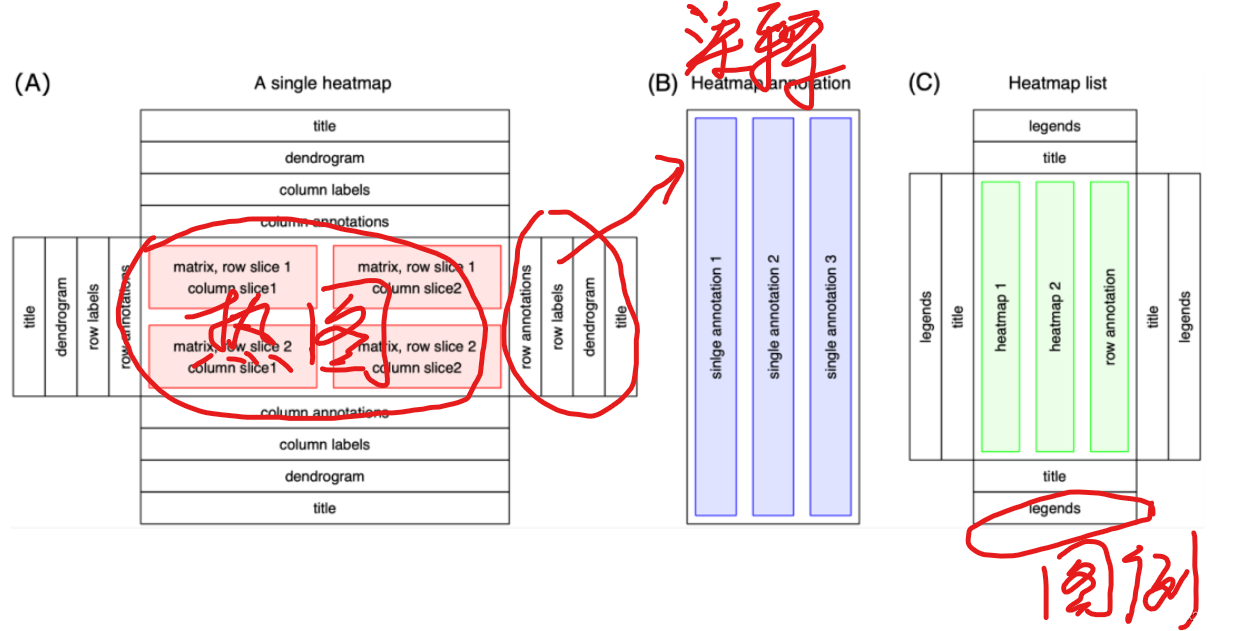
单个热图由热图主体和各种热图组件组成(图 1A)。热图主体是具有单个颜色格子的二维排列,其中每个格子对应于输入矩阵中的一个特定值。热图组件包含标题、系统树图(dendrogram)、矩阵行和列的文字标签以及热图注释。这些组件可以放置在热图主体的四个侧面,每个组件都由为Heatmap对象定义的特定方法所管理。此外,热图主体可以在行和列上进行切分。
热图注释包含与热图的行或列相关的附加信息。ComplexHeatmap 为设置不同的注释图形和定义新的注释图形提供了丰富的支持。热图注释可以作为热图的组件放在其四个侧面,也可以独立和热图连接。HeatmapAnnotation 对象包含一组由 SingleAnnotation 类定义的单个注释(图 1B),其中每个单独注释都包含一种特定类型的图形,该图形由 AnnotationFunction 类进一步定义。AnnotationFunction 类提供了一种灵活的方式来定义新的注释图形,更重要的是,自定义的注释图形可以根据主热图而进行自动重新排序和切分。
ComplexHeatmap 的主要特点是它支持水平或垂直连接一组热图和注释,以便于可视化不同数据源之间的关联。HeatmapList 类是一组热图和注释的容器(图 1C),它会自动调整多个热图和注释中行或列的对应关系。
Heatmap绘图基础参数
数据
rm(list = ls())
library(ComplexHeatmap)
library(circlize)
##数据模拟##
set.seed(123)
nr1 = 4; nr2 = 8; nr3 = 6; nr = nr1 + nr2 + nr3
nc1 = 6; nc2 = 8; nc3 = 10; nc = nc1 + nc2 + nc3
mat = cbind(rbind(matrix(rnorm(nr1*nc1, mean = 1,   sd = 0.5), nr = nr1),matrix(rnorm(nr2*nc1, mean = 0,   sd = 0.5), nr = nr2),matrix(rnorm(nr3*nc1, mean = 0,   sd = 0.5), nr = nr3)),rbind(matrix(rnorm(nr1*nc2, mean = 0,   sd = 0.5), nr = nr1),matrix(rnorm(nr2*nc2, mean = 1,   sd = 0.5), nr = nr2),matrix(rnorm(nr3*nc2, mean = 0,   sd = 0.5), nr = nr3)),rbind(matrix(rnorm(nr1*nc3, mean = 0.5, sd = 0.5), nr = nr1),matrix(rnorm(nr2*nc3, mean = 0.5, sd = 0.5), nr = nr2),matrix(rnorm(nr3*nc3, mean = 1,   sd = 0.5), nr = nr3))
)
mat = mat[sample(nr, nr), sample(nc, nc)] # random shuffle rows and columns
rownames(mat) = paste0("row", seq_len(nr))
colnames(mat) = paste0("column", seq_len(nc))
作图参数
#颜色设置#
col_fun = colorRamp2(c(-2, 0, 2),#范围c("green", "white", "red"))
col_fun(seq(-3, 3))#ht_opt$TITLE_PADDING = unit(c(8.5, 8.5), "points")#用于画板大小设置
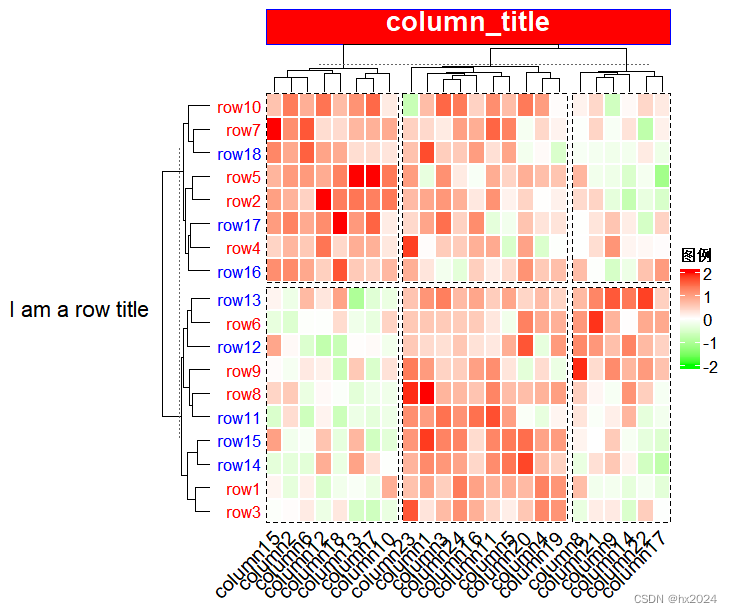
p <- Heatmap(mat, name = "图例", #图例名称col = col_fun, #颜色设置 column_title = "column_title", ##列标题#column_title_gp = gpar(fontsize = 16, fontface = "bold"),##列标题格式设置column_title_gp = gpar(fill = "red", ##将标题设置方块填充颜色col = "white", ##字体颜色border = "blue", ##边界颜色fontsize = 16, ##字体大小fontface = "bold"),row_title = "I am a row title", ##行标题row_title_rot = 0, ##行标题旋转(只能垂直和水平)na_col = "black", #NA值颜色设置(如果dataframe里含有NA值)border_gp = gpar(col = "black", lty = 2), ##整个边界线设置rect_gp = gpar(col = "white", lwd = 2), ##热图矩阵线设置cluster_rows = T, ##侧面的行聚类树显示设置 FALSE不显示show_column_dend = T, ##上面的列聚类树显示设置row_dend_side = "left", #行聚类树位置right leftcolumn_dend_side = "top", #列聚类树位置top bottomrow_names_side = "left", ##行名位置设置row_names_gp = gpar(fontsize = 10, ##行名大小及颜色设置col = c(rep("red", 10), rep("blue", 8))), column_names_side = "bottom", ##列名位置设置column_names_rot = 45, ##列名旋转设置row_km = 2, ##行切割column_km = 3 ##列切割 或者直接设置位置column_split = 2)p
dev.off()
 ComplexHeatmap绘制热图并进行个性化标注_complexheatmap图例修改-CSDN博客
Heatmap Annotations(注释)
基础注释设置
dev.off()
rm(list = ls())
library(ComplexHeatmap)
library(circlize)
set.seed(123)
mat = matrix(rnorm(100), 10)
rownames(mat) = paste0("R", 1:10)
colnames(mat) = paste0("C", 1:10)
head(mat)C1 C2 C3 C4 C5 C6 R1 -0.56047565 1.2240818 -1.0678237 0.4264642 -0.6947070 0.25331851 R2 -0.23017749 0.3598138 -0.2179749 -0.2950715 -0.2079173 -0.02854676
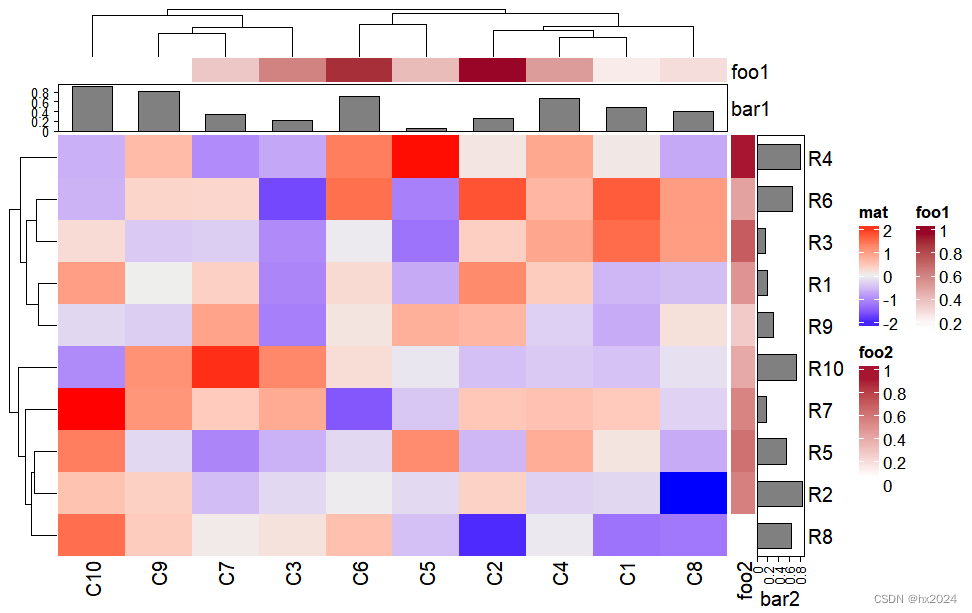
##列的注释:生成随机的1:10数值,然后制作色块和棒状图
column_ha = HeatmapAnnotation(foo1 = runif(10),bar1 = anno_barplot(runif(10)))
##行的注释
row_ha = rowAnnotation(foo2 = runif(10), bar2 = anno_barplot(runif(10)))
Heatmap(mat, name = "mat", top_annotation = column_ha, right_annotation = row_ha)
简单注释测试
##创建一个新页面用于绘图测试##
grid.newpage()
pushViewport(viewport(y = 0.7, height = 0.6, width = 0.8))
#颜色设置
col_fun = colorRamp2(c(0, 5, 10), c("blue", "white", "red"))#未指定颜色会生成随机颜色
ha = HeatmapAnnotation(foo = 1:10, col = list(foo = col_fun))
draw(ha)
dev.off()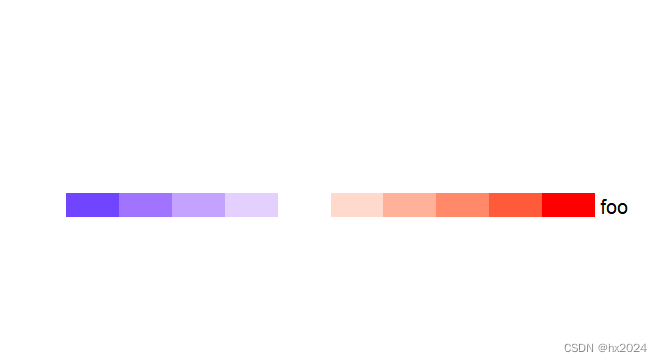
单个注释和数据框可以混合使用
grid.newpage()
pushViewport(viewport(y = 0.7, height = 0.6, width = 0.8))
#颜色设置
col_fun = colorRamp2(c(0, 5, 10), c("blue", "white", "red"))#未指定颜色会生成随机颜色
ha = HeatmapAnnotation(df = anno_df,foo2 = rnorm(10),col = list(foo = col_fun,bar = c("a" = "red", "b" = "green", "c" = "blue"))
)
draw(ha)
dev.off()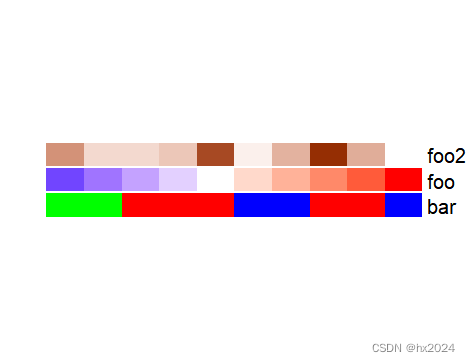
注释可以为多种形式
anno_points散点注释
grid.newpage()
pushViewport(viewport(y = 0.7, height = 0.6, width = 0.8))
ha = HeatmapAnnotation(foo = anno_points(runif(10)))
draw(ha)
dev.off()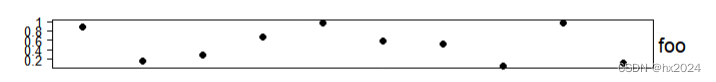
anno_lines连线注释
grid.newpage()
pushViewport(viewport(y = 0.7, height = 0.6, width = 0.8))
ha = HeatmapAnnotation(foo = anno_lines(runif(10)))
draw(ha)
dev.off()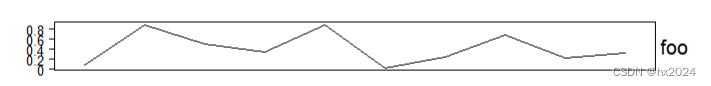
anno_barplot条形图
grid.newpage()
pushViewport(viewport(y = 0.7, height = 0.6, width = 0.8))
ha = HeatmapAnnotation(foo = anno_barplot(1:10))
draw(ha)
dev.off()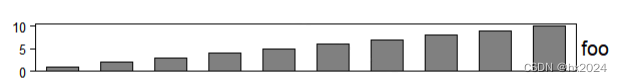
ha = HeatmapAnnotation(foo = anno_barplot(1:10, bar_width = 1))#修改宽度
ha = HeatmapAnnotation(foo = anno_barplot(1:10, gp = gpar(fill = 1:10)))#颜色填充
ha = HeatmapAnnotation(foo = anno_barplot(seq(-5, 5), baseline = 0))#基线设置

还可以进行堆砌图和翻转
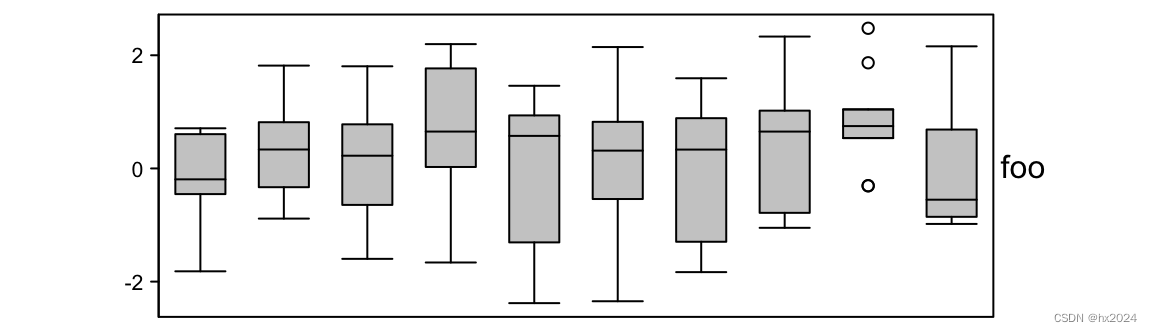
anno_boxplot箱线图
grid.newpage()
pushViewport(viewport(y = 0.7, height = 0.6, width = 0.8))
set.seed(12345)
m = matrix(rnorm(100), 10)
ha = HeatmapAnnotation(foo = anno_boxplot(m, height = unit(4, "cm")))
draw(ha)
dev.off()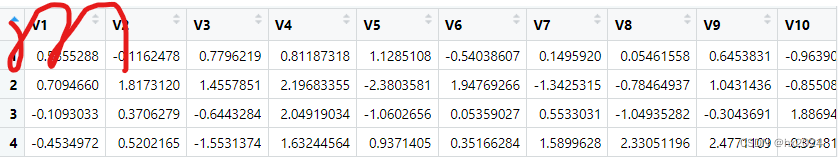
anno_histogram直方图
grid.newpage()
pushViewport(viewport(y = 0.7, height = 0.6, width = 0.8))
m = matrix(rnorm(1000), nc = 100)
ha = rowAnnotation(foo = anno_histogram(m)) # apply `m` on rows
draw(ha)
dev.off()

还有水平注解文本注解等功能第 3 章 热图注释 |ComplexHeatmap 完整参考 (jokergoo.github.io)
热图组合
基础组合
rm(list = ls())
library(ComplexHeatmap)
library(circlize)set.seed(123)#生成矩阵数据1
mat1 = matrix(rnorm(80, 2), 8, 10)
mat1 = rbind(mat1, matrix(rnorm(40, -2), 4, 10))
rownames(mat1) = paste0("R", 1:12)
colnames(mat1) = paste0("C", 1:10)
##生成矩阵数据2
mat2 = matrix(runif(60, max = 3, min = 1), 6, 10)
mat2 = rbind(mat2, matrix(runif(60, max = 2, min = 0), 6, 10))
rownames(mat2) = paste0("R", 1:12)
colnames(mat2) = paste0("C", 1:10)le = sample(letters[1:3],      #随机字母A B C 12, replace = TRUE)#生成一个1:12的随机向量
names(le) = paste0("R", 1:12)ind = sample(12, 12)#随机提取12个样本
mat1 = mat1[ind, ]
mat2 = mat2[ind, ]
le = le[ind]
进行组合
#绘制热图
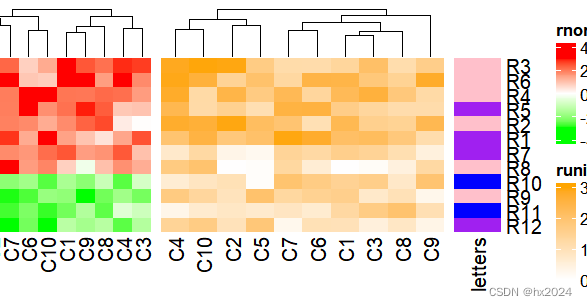
ht1 = Heatmap(mat1, name = "rnorm")
ht2 = Heatmap(mat2, name = "runif")
ht3 = Heatmap(le, name = "letters")
#进行组合
ht1 + ht2 + ht3dev.off()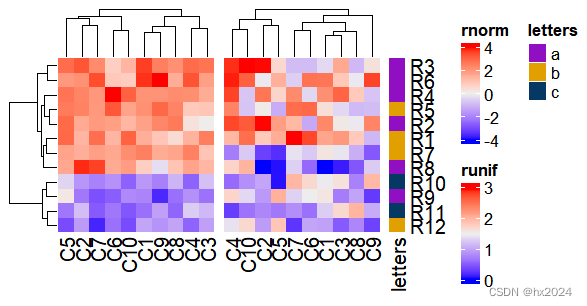
在默认模式下,将删除第二个热图中的树状图,并 行顺序将与第一个行顺序相同。还有前两个的行名 热图也会被删除。
进行调整(水平串联)
col_rnorm = colorRamp2(c(-3, 0, 3), c("green", "white", "red"))
col_runif = colorRamp2(c(0, 3), c("white", "orange"))
col_letters = c("a" = "pink", "b" = "purple", "c" = "blue")
ht1 = Heatmap(mat1, name = "rnorm", col = col_rnorm,row_title = "Heatmap 1", column_title = "Heatmap 1")
ht2 = Heatmap(mat2, name = "runif", col = col_runif,row_title = "Heatmap 2", column_title = "Heatmap 2")
ht3 = Heatmap(le, name = "letters", col = col_letters)
ht_list = ht1 + ht2 + ht3draw(ht_list,  ##绘图,然后添加细节row_title = "Three heatmaps, row title", row_title_gp = gpar(col = "red"),column_title = "Three heatmaps, column title", column_title_gp = gpar(fontsize = 16))
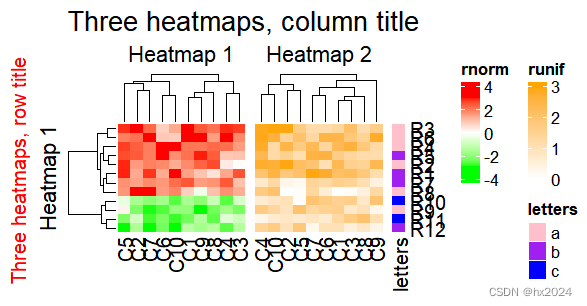
还可以进行大小设置
dev.off()
ht1 = Heatmap(mat1, name = "rnorm", col = col_rnorm, width = unit(4, "cm"))
ht2 = Heatmap(mat2, name = "runif", col = col_runif, width = unit(6, "cm"))
ht3 = Heatmap(le, name = "letters", col = col_letters, width = unit(1, "cm"))
ht1 + ht2 + ht3
垂直串联(使用%v%连接)
数据一样的
rm(list = ls())
library(ComplexHeatmap)
library(circlize)set.seed(123)#生成矩阵数据1
mat1 = matrix(rnorm(80, 2), 8, 10)
mat1 = rbind(mat1, matrix(rnorm(40, -2), 4, 10))
rownames(mat1) = paste0("R", 1:12)
colnames(mat1) = paste0("C", 1:10)
##生成矩阵数据2
mat2 = matrix(runif(60, max = 3, min = 1), 6, 10)
mat2 = rbind(mat2, matrix(runif(60, max = 2, min = 0), 6, 10))
rownames(mat2) = paste0("R", 1:12)
colnames(mat2) = paste0("C", 1:10)le = sample(letters[1:3],      #随机字母A B C 12, replace = TRUE)#生成一个1:12的随机向量
names(le) = paste0("R", 1:12)ind = sample(12, 12)#随机提取12个样本
mat1 = mat1[ind, ]
mat2 = mat2[ind, ]
le = le[ind]
#颜色设置
col_rnorm = colorRamp2(c(-3, 0, 3), c("green", "white", "red"))
col_runif = colorRamp2(c(0, 3), c("white", "orange"))
col_letters = c("a" = "pink", "b" = "purple", "c" = "blue")##垂直串联
mat1t = t(mat1)
mat2t = t(mat2)
ht1 = Heatmap(mat1t, name = "rnorm", col = col_rnorm, row_title = "rnorm")
ht2 = Heatmap(mat2t, name = "runif", col = col_runif, row_title = "runif")
ht3 = Heatmap(rbind(letters = le), name = "letters", col = col_letters)
ht_list = ht1 %v% ht2 %v% ht3
draw(ht_list)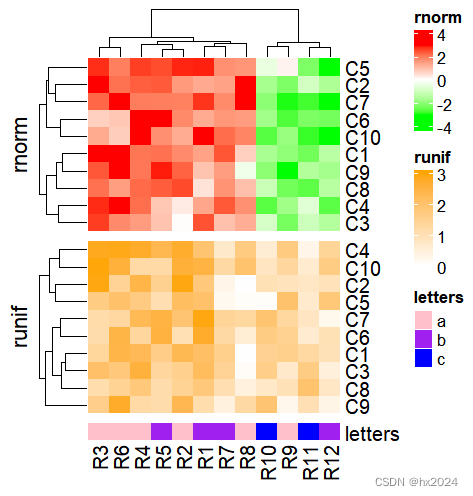
第五章 传奇 |ComplexHeatmap 完整参考 (jokergoo.github.io)
这篇关于ComplexHeatmap绘图:注释、图例、热图基础(自备)的文章就介绍到这儿,希望我们推荐的文章对编程师们有所帮助!


