本文主要是介绍38 mars3d 对接地图图层 绘制点线面员,希望对大家解决编程问题提供一定的参考价值,需要的开发者们随着小编来一起学习吧!
前言
这里主要是展示一下 mars3d 的一个基础的使用
主要是设计 接入地图服务器的 卫星地图, 普通的二维地图, 增加地区标记
基础绘制 点线面园 等等
测试用例
<template><div style="width: 1920px; height:1080px;"><div class="mars3dClass" id="mars3dClass"></div></div></template><script>import * as mars3d from "mars3d";const Cesium = mars3d.Cesium;export default {name: "mars3dMapUsage",components: {},props: {},data() {return {map: null,tdtImgLayer: null,labelLayer: null,overlay: null,mapOptions:{scene: {center: {"lat":31.376588,"lng":104.803391,"alt":539.5,"heading":273.6,"pitch":-40.1}},basemaps:[{type:'group',layers:[{name:'3dtiles地图',type:'xyz',url:'/terrainresource/scmf_0to19/{z}/{x}/{y}.png',}],show:true},]},};},computed: {},watch: {},created() {},mounted() {this.initMap()// this.test01AddBoundsLayer()// this.test02AddDtImageLayer()// this.test03AddDtTDLayer()// this.test04AddDtLabelLayer()this.test11AddTerrainLayer()// this.test05AddImageLayer()// this.test06AddCircleLayer([104.065735, 30.759462])// this.test06AddCircleLayer([104.065735, 30.559462], "red")// this.test07AddBoxLayer()// this.test08AddCylinderLayer()// this.test09AddPolylineVolumeLayer()},methods: {initMap() {this.map = new mars3d.Map("mars3dClass")this.map.setCameraView({lng: 104.065735, lat: 30.659462, alt: 44160})},test01AddBoundsLayer() {},test02AddDtImageLayer() {const tdtImgLayer = new mars3d.layer.TdtLayer({url: "/tianditu/servlet/GoogleSatelliteMap?x={x}&y={y}&z={z}",zIndex: 1,crs: mars3d.CRS.EPSG4490});this.map.addLayer(tdtImgLayer);},test03AddDtTDLayer() {const tdtImgLayer = new mars3d.layer.TdtLayer({url: "/tianditu/servlet/GoogleTDMap?x={x}&y={y}&z={z}",zIndex: 1,crs: mars3d.CRS.EPSG4490});this.map.addLayer(tdtImgLayer);},test04AddDtLabelLayer() {const labelLayer = new mars3d.layer.TdtLayer({url: "/tianditu/servlet/GoogleTransparentMap?x={x}&y={y}&z={z}",zIndex: 1,crs: mars3d.CRS.EPSG4490});this.map.addLayer(labelLayer);},test05AddImageLayer() {const graphicLayer = new mars3d.layer.GraphicLayer({zIndex: 20});this.map.addLayer(graphicLayer);const graphic = new mars3d.graphic.BillboardEntity({name: "贴地图标",position: [104.065735, 30.659462, 1000],style: {image: "/img/theme/desktop/17.jpg",scale: 1,horizontalOrigin: mars3d.Cesium.HorizontalOrigin.CENTER,verticalOrigin: mars3d.Cesium.VerticalOrigin.BOTTOM,clampToGround: true,},attr: {remark: "示例3"},});graphicLayer.addGraphic(graphic);},test06AddCircleLayer(coord, color) {const graphicLayer = new mars3d.layer.GraphicLayer({zIndex: 20});this.map.addLayer(graphicLayer);const graphic = new mars3d.graphic.CircleEntity({position: [coord[0], coord[1], 1000],style: {radius: 1800.0,color: color,opacity: 1,outline: true,outlineWidth: 3,outlineColor: color,clampToGround: true,},popup: "直接传参的popup",attr: { remark: "示例6" },});graphicLayer.addGraphic(graphic);},test07AddBoxLayer() {const graphicLayer = new mars3d.layer.GraphicLayer({zIndex: 20});this.map.addLayer(graphicLayer);const graphic = new mars3d.graphic.BoxEntity({position: new mars3d.LngLatPoint(104.165735, 30.759462, 1000),style: {dimensions: new Cesium.Cartesian3(2000.0, 2000.0, 2000.0),fill: true,color: "#00ffff",opacity: 0.9,heading: 45,roll: 45,pitch: 0,},attr: { remark: "示例5" },});graphicLayer.addGraphic(graphic);},test08AddCylinderLayer() {const graphicLayer = new mars3d.layer.GraphicLayer({zIndex: 20});this.map.addLayer(graphicLayer);const graphic = new mars3d.graphic.CylinderEntity({position: [104.265735, 30.759462, 1000],style: {length: 3000.0,topRadius: 0.0,bottomRadius: 1300.0,color: "#00FFFF",opacity: 0.7,},popup: "直接传参的popup",attr: { remark: "示例7" },});graphicLayer.addGraphic(graphic);},test09AddPolylineVolumeLayer() {const graphicLayer = new mars3d.layer.GraphicLayer({zIndex: 20});this.map.addLayer(graphicLayer);const graphic = new mars3d.graphic.PolylineVolumeEntity({positions: [[103.965735, 30.759462, 1000],[103.975735, 30.81, 1000],[103.985735, 30.79, 1000],],style: {shape: "pipeline",radius: 80,color: "#3388ff",opacity: 0.9,},attr: { remark: "示例11" },});graphicLayer.addGraphic(graphic);},test10SetCenter(coord, color) {this.map.setCameraView(coord);},test11AddTerrainLayer() {this.map.setCameraView({lng: 104.803391, lat: 31.376588, alt: 539.5,heading:273.6,pitch:-40.1});const layer = new mars3d.layer.XyzLayer({url: "/terrainresource/xxx/{z}/{x}/{y}.png",zIndex: 1,});this.map.addLayer(layer);}}};
</script><style lang="scss">.mars3dMapUsageClass {}.overdelay1 {position: absolute;border: 1px greenyellow solid;width: 200px;height: 50px;}
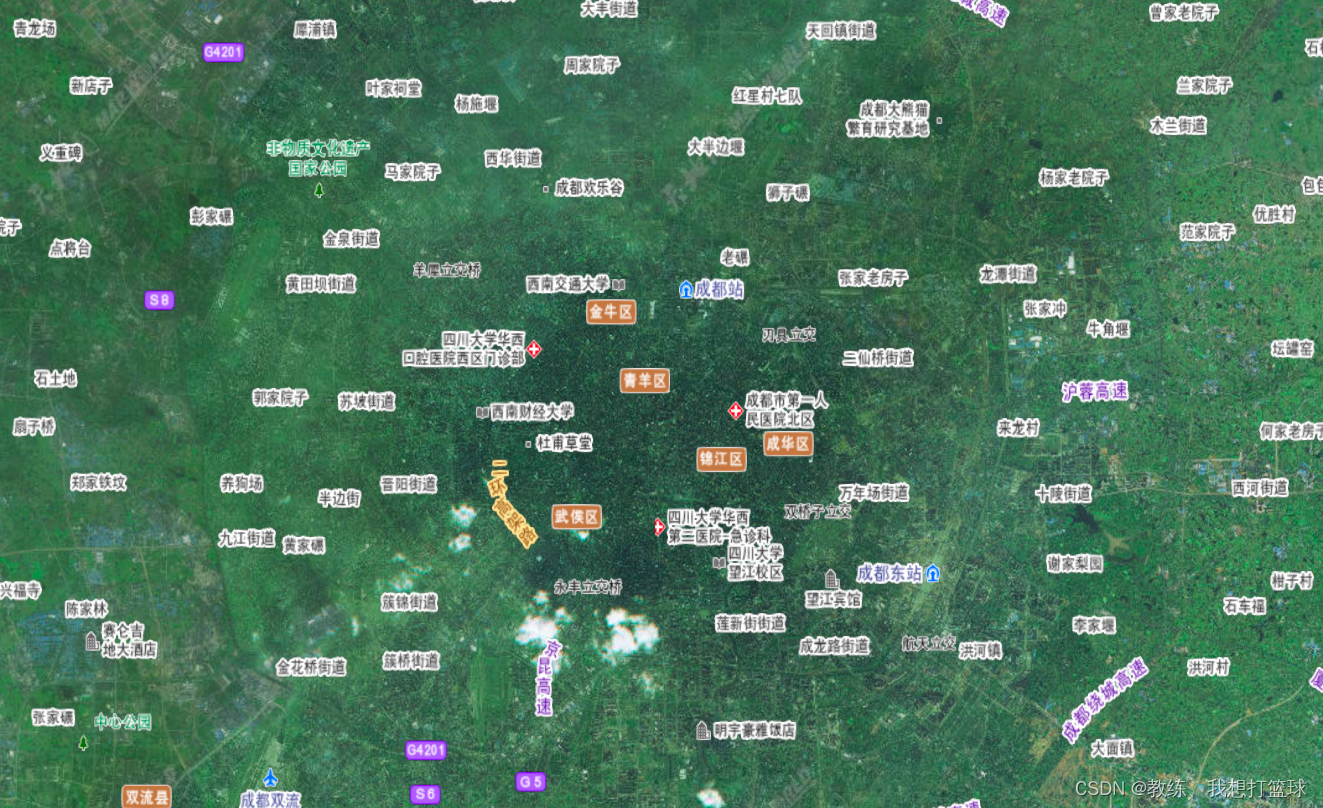
</style>绘制卫星地图 + 地图标注
执行效果如下
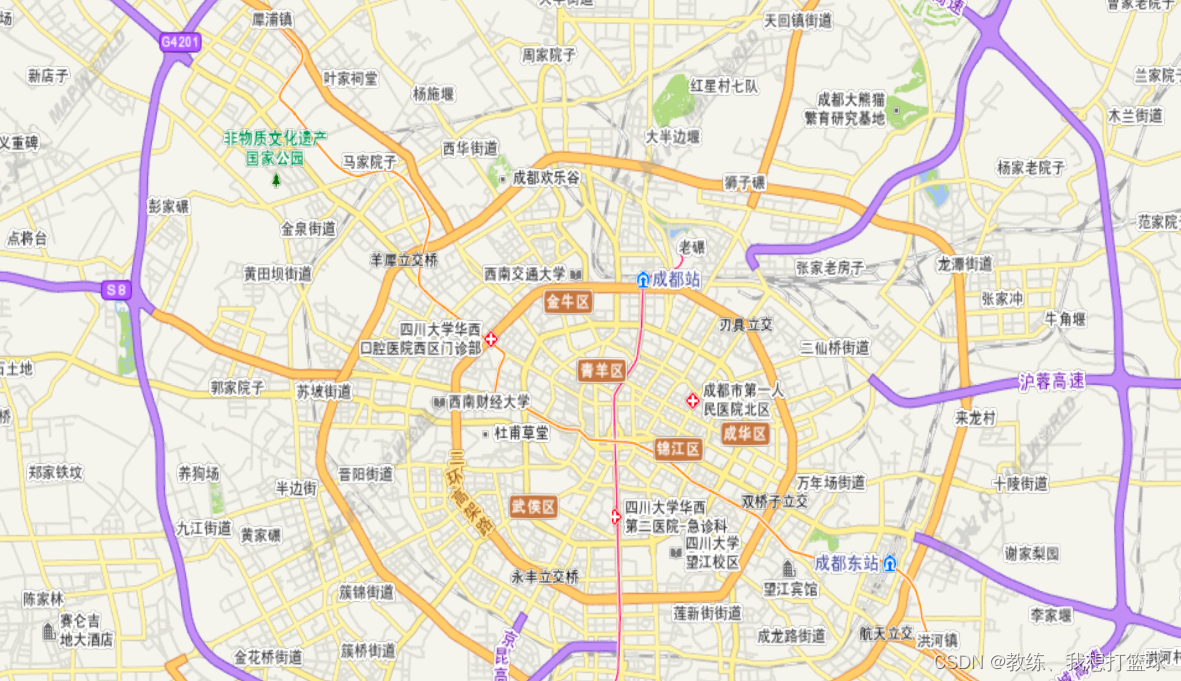
二维地图 + 地图标注
执行效果如下
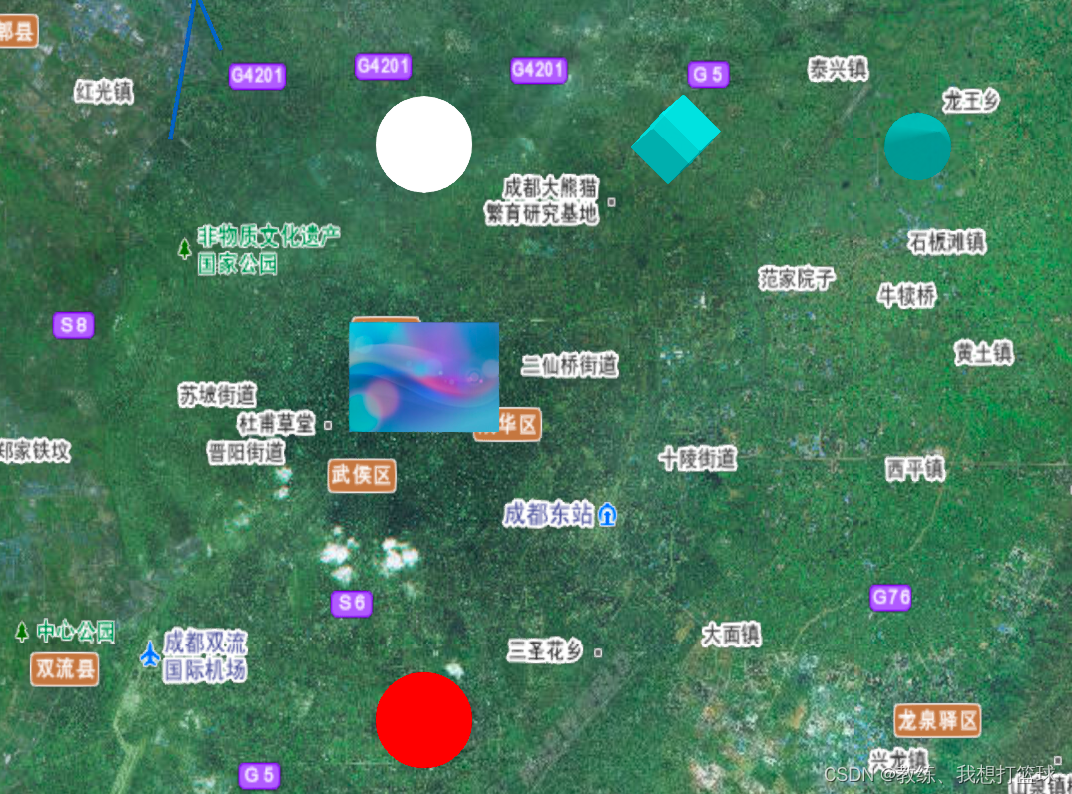
绘制点线面园
执行效果如下

卫星地图 + 地图标注 + 点线面园
执行效果如下
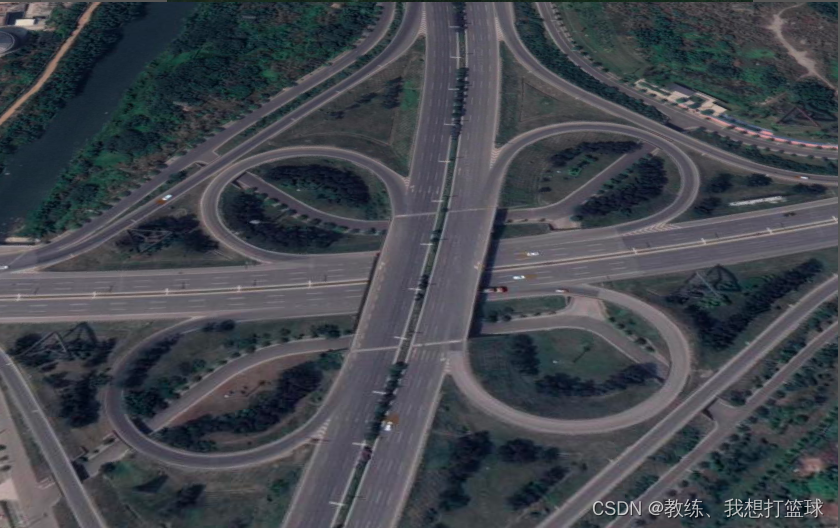
地形资源页面
执行效果如下
完
这篇关于38 mars3d 对接地图图层 绘制点线面员的文章就介绍到这儿,希望我们推荐的文章对编程师们有所帮助!


