本文主要是介绍ELK之使用Filebeat插件收集日志到Logstash,希望对大家解决编程问题提供一定的参考价值,需要的开发者们随着小编来一起学习吧!
对于Springboot项目接入ELK非常方便,对于非maven,非Spring项目来说就比较复杂,这个时候我们就可以使用Filebeat插件还完成日志的收集发送工作。
Filebeat介绍
Filebeat是用于转发和收集数据的轻量级工具,Filebeat可以监视指定的日志文件或位置,收集日志事件,并将数据转发到Elasticsearch或Logstash进行存储。
Filebeat的工作方式
启动Filebeat时,它将启动一个或多个输入;这些输入将在指定的位置中查找数据,对于Filebeat所找到的每个日志,Filebeat都会启动收集器。每个收集器都读取单个日志以获取新内容,并将新日志数据发送到libbeat,libbeat将聚集事件,并将聚集的数据发送到位Filebeat配置的输出。
Filebeat由两个主要组成部分:Prospector(探勘者)和Harvesters(矿车)。
prospector: 负责找到所有需要进行读取的数据源。
harvesters : 负责读取单个文件的内容,并将内容发送到output,负责文件的打开和关闭。prospector和harvesters 这些组件一起工作来读取文件并将时间数据发送到指定的output。
Filebeat的工作原理
Filebeat可以记录每个日志文件的状态(可以理解成就是offset),并且把这个状态从注册表里更新到磁盘,offset是用来记录上一次Harvaster读取文件时,读取到的位置;这样来保证能把全部的日志都读取出来发给output。
如果,作为output的Elasticsearch或则Logstash变成了不可用,Filebeat将会把最后的文件读取位置保存下来,直到output重新可用的时候,快速地恢复文件数据的读取。
在Filebeat运行过程中,每个Prospector的状态信息都会保存在内存里,如果Filebeat出现了重启,完成重启后,会从注册表文件里恢复重启之间的状态信息,让Filebeat继续从之间已知的位置开始进行读取数据。
安装并配置Filebeat
1. 下载Filebeat
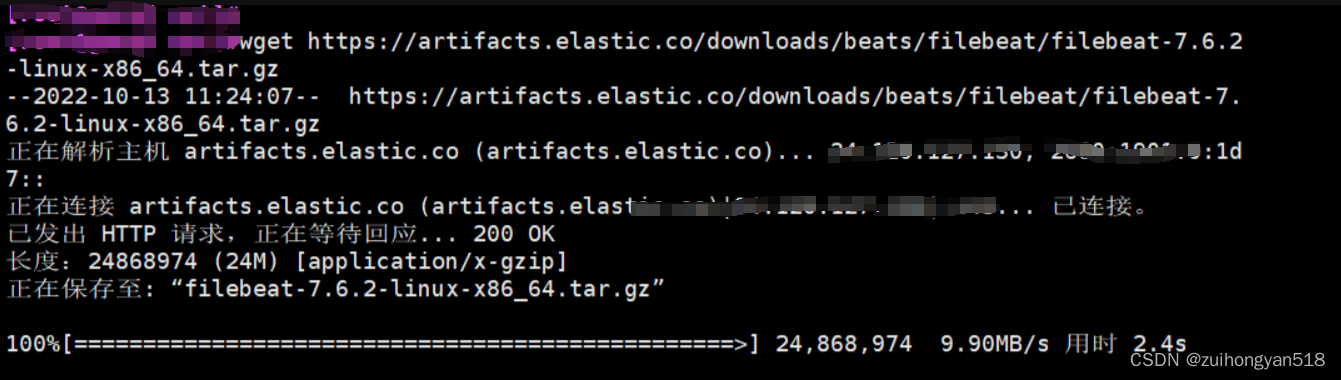
方式1:wget命令下载filebeat
wget https://artifacts.elastic.co/downloads/beats/filebeat/filebeat-7.6.2-linux-x86_64.tar.gz方式2:也可以直接下载到本地上传到服务器上
下载地址:Filebeat 7.6.2 | Elastic
下载完成后使用命令将其解压:
tar -zxvf filebeat-6.6.0-linux-x86_64.tar.gz
2. 配置Filebeat
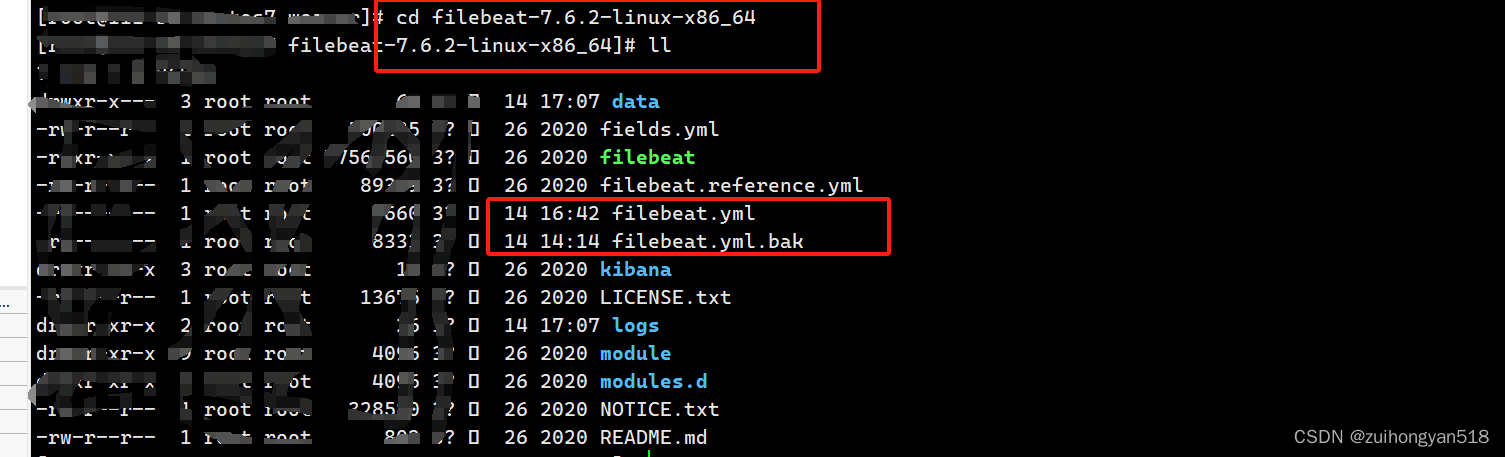
进入解压目录
[root@cenos7~] cd filebeat-7.6.2-linux-x86_64
# 备份filebest主配置文件
[root@cenos7 filebeat-7.6.2-linux-x86_64] cp filebeat.yml filebeat.yml.bak
# vim命令打开配置文件 进行配置
[root@cenos7 filebeat-7.6.2-linux-x86_64] vim filebeat.yml
配置日志采集
参看文档:https://www.elastic.co/guide/en/beats/filebeat/current/configuration-filebeat-options.html
#=========================== Filebeat inputs =============================filebeat.inputs:# Each - is an input. Most options can be set at the input level, so
# you can use different inputs for various configurations.
# Below are the input specific configurations.- type: log# Change to true to enable this input configuration.enabled: true# Paths that should be crawled and fetched. Glob based paths.# 配置要收集日志文件路径paths:- /usr/local/test_app/log/test_app.logencoding: utf-8#- c:\programdata\elasticsearch\logs\*# Exclude lines. A list of regular expressions to match. It drops the lines that are# matching any regular expression from the list.exclude_lines: ['DEBUG','INFO'] #不收集 'DEBUG','INFO' 级别日志# Include lines. A list of regular expressions to match. It exports the lines that are# matching any regular expression from the list.include_lines: ['ERROR','Exception','^WARN'] #收集 'ERROR','Exception', 'WARN' 级别日志# Exclude files. A list of regular expressions to match. Filebeat drops the files that# are matching any regular expression from the list. By default, no files are dropped.#exclude_files: ['.gz$']......#================================ General =====================================# The name of the shipper that publishes the network data. It can be used to group
# all the transactions sent by a single shipper in the web interface.
#name:# The tags of the shipper are included in their own field with each
# transaction published.
#tags: ["service-X", "web-tier"]# Optional fields that you can specify to add additional information to the
# output.
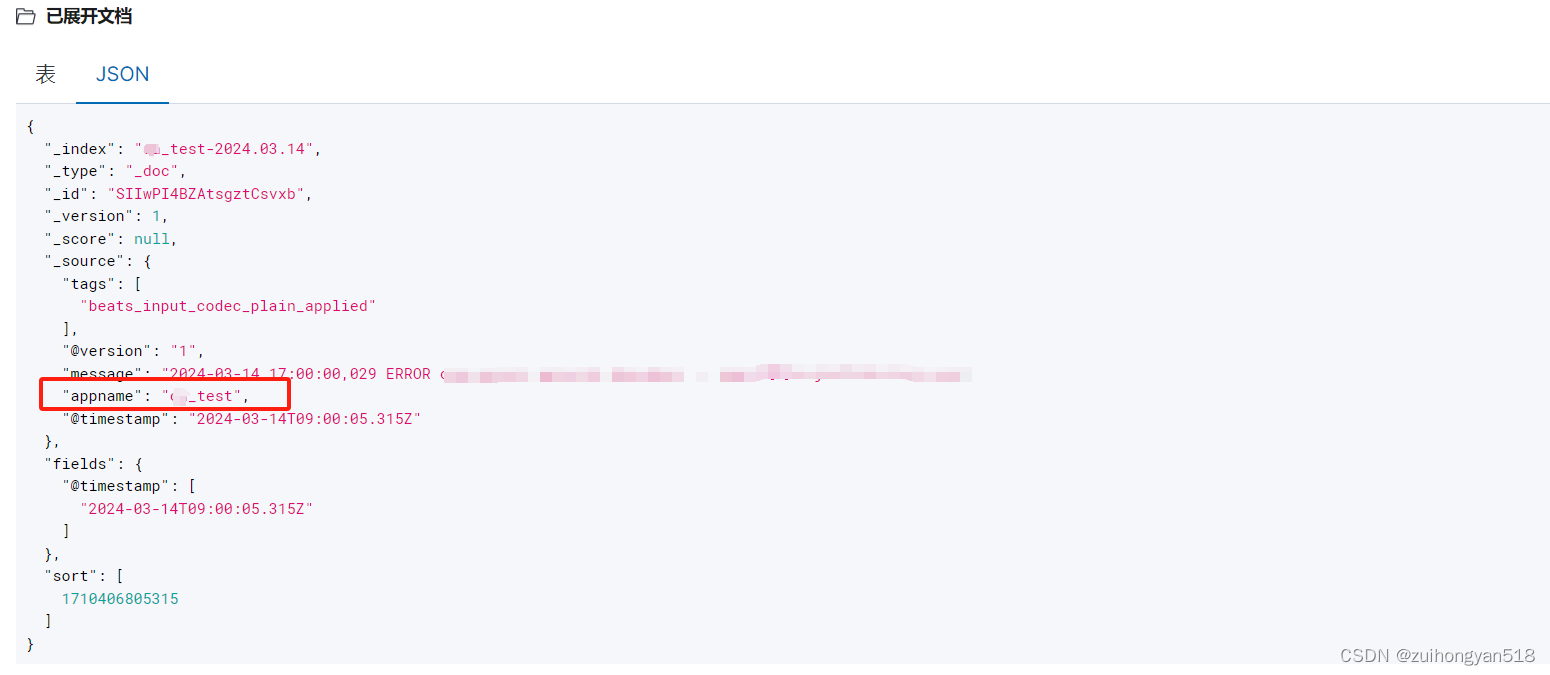
fields:appname: oa_test # key-value 添加额外字段 收集到日志中
fields_under_root: true......
#============================== Kibana =====================================# Starting with Beats version 6.0.0, the dashboards are loaded via the Kibana API.
# This requires a Kibana endpoint configuration.
setup.kibana:# Kibana Host# Scheme and port can be left out and will be set to the default (http and 5601)# In case you specify and additional path, the scheme is required: http://localhost:5601/path# IPv6 addresses should always be defined as: https://[2001:db8::1]:5601#host: "localhost:5601"# Kibana Space ID# ID of the Kibana Space into which the dashboards should be loaded. By default,# the Default Space will be used.#space.id:#============================= Elastic Cloud ==================================# These settings simplify using Filebeat with the Elastic Cloud (https://cloud.elastic.co/).# The cloud.id setting overwrites the `output.elasticsearch.hosts` and
# `setup.kibana.host` options.
# You can find the `cloud.id` in the Elastic Cloud web UI.
#cloud.id:# The cloud.auth setting overwrites the `output.elasticsearch.username` and
# `output.elasticsearch.password` settings. The format is `<user>:<pass>`.
#cloud.auth:#================================ Outputs =====================================# Configure what output to use when sending the data collected by the beat.#-------------------------- Elasticsearch output ------------------------------
#output.elasticsearch:# Array of hosts to connect to.# hosts: ["localhost:9200"]# Protocol - either `http` (default) or `https`.#protocol: "https"# Authentication credentials - either API key or username/password.#api_key: "id:api_key"#username: "elastic"#password: "changeme"#----------------------------- Logstash output --------------------------------
output.logstash:# The Logstash hosts 配置你自己的Logstash ip地址hosts: ["127.0.0.1:5044","127.0.0.1:5044"]# Optional SSL. By default is off.# List of root certificates for HTTPS server verifications#ssl.certificate_authorities: ["/etc/pki/root/ca.pem"]# Certificate for SSL client authentication#ssl.certificate: "/etc/pki/client/cert.pem"# Client Certificate Key#ssl.key: "/etc/pki/client/cert.key"......#================================= Migration ==================================# This allows to enable 6.7 migration aliases
#migration.6_to_7.enabled: true配置完成以后就可以启动filebeat。
# 前台启动
[root@cenos7 filebeat-7.6.2-linux-x86_64] ./filebeat -e -c filebeat.yml
# 后台启动
[root@cenos7 filebeat-7.6.2-linux-x86_64] nohup ./filebeat -e -c filebeat.yml > logs/filebeat.log 2>&1 &
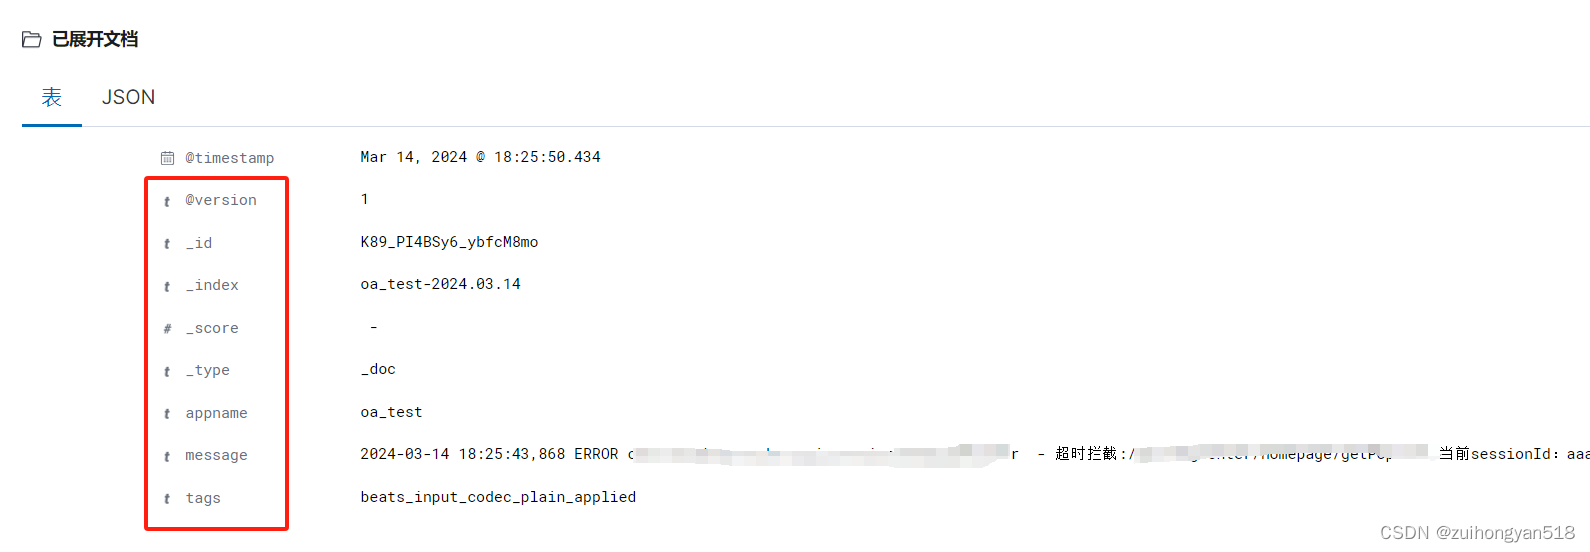
3. Kibana检索
其他重要配置
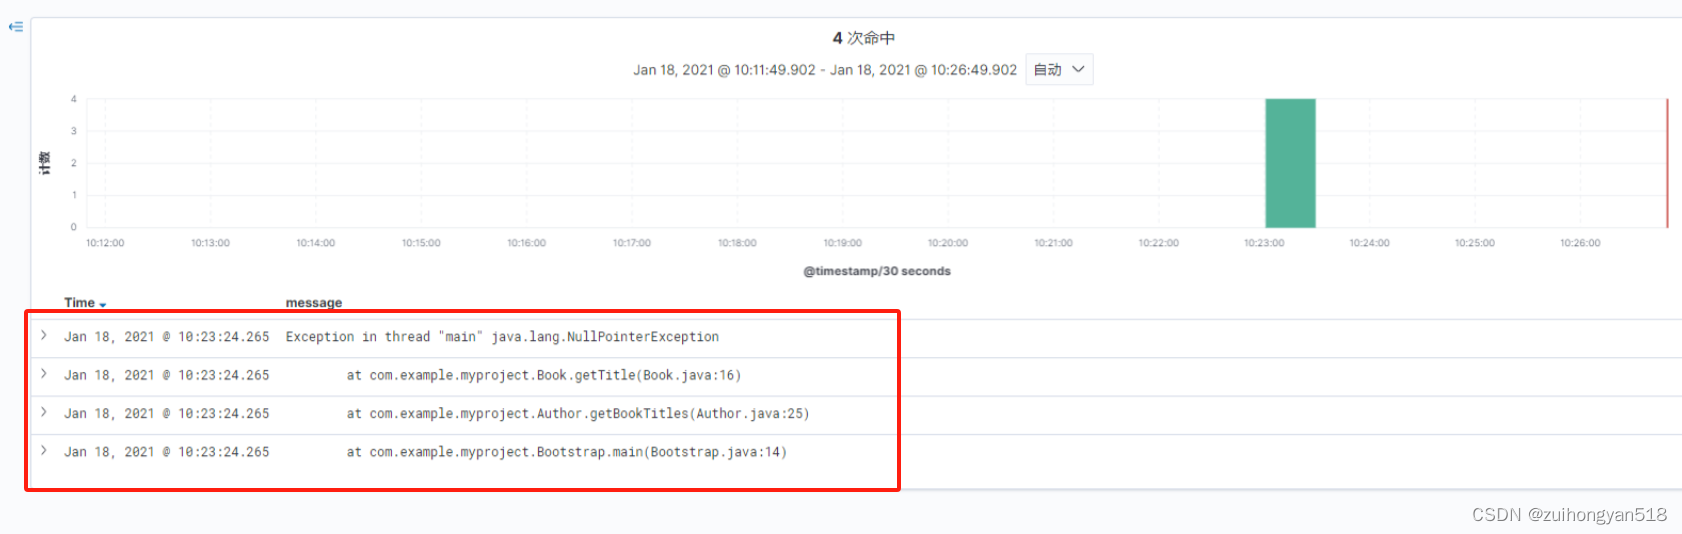
一般java异常,堆栈信息比较多,换行展示的,但是Filebeat收集的时候按行收集的,这算是一个缺陷。不过我们可以配置进行全部收集。
例如,常见的Java堆栈日志:
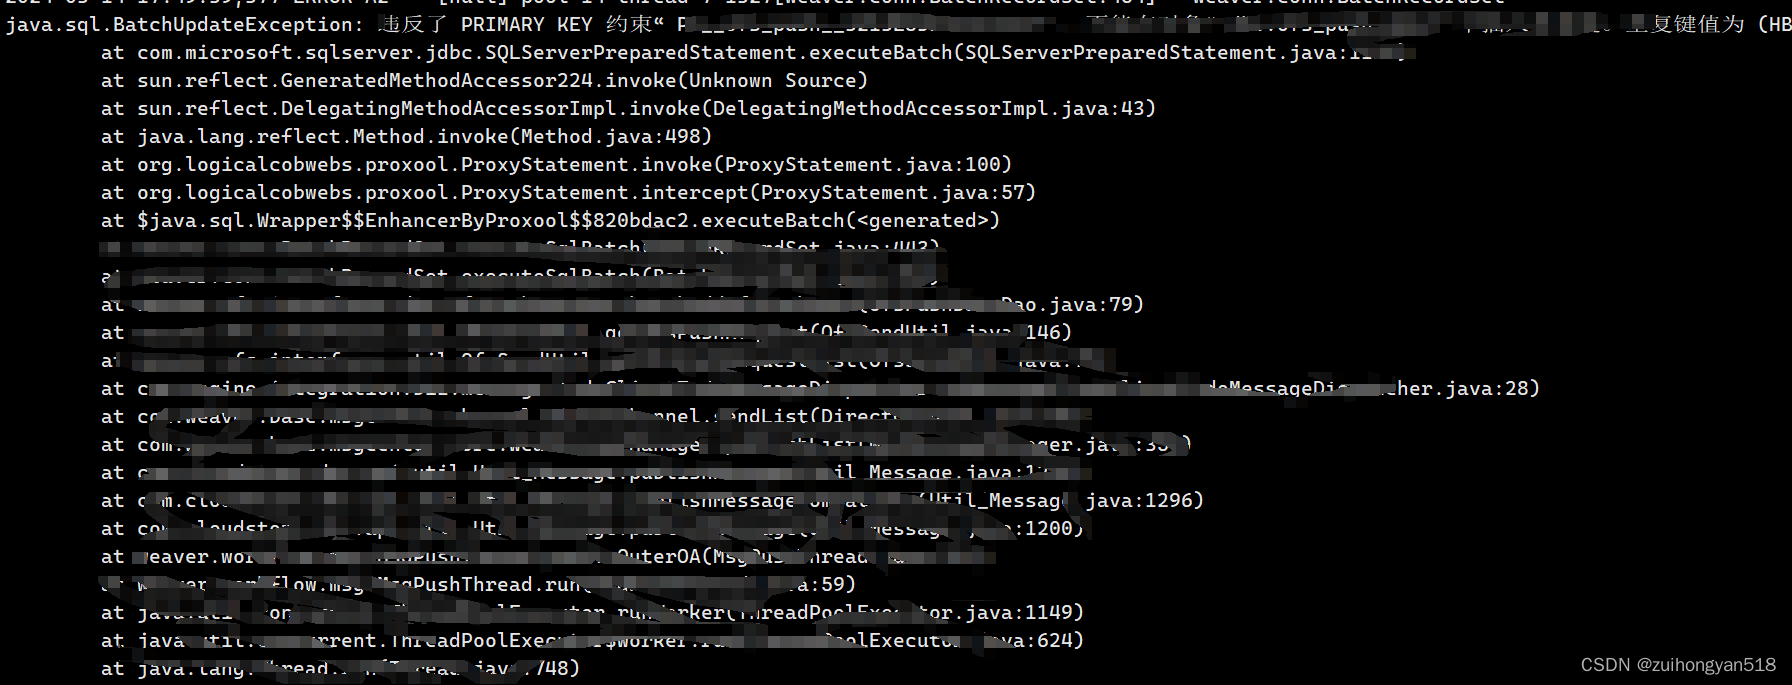
上面文档表示很多行,在Kibana里也视为多个单独的文档,但实际这是一个异常日志,如果分开阅读会脱离上下文关系,不利于分析。
1. 配置合并日志
### Multiline options# Multiline can be used for log messages spanning multiple lines. This is common# for Java Stack Traces or C-Line Continuation# The regexp Pattern that has to be matched. The example pattern matches all lines starting with [multiline.pattern: '^\d{4}-\d{2}-\d{2}' # 匹配以 YYYY-MM-DD开头的行 # Defines if the pattern set under pattern should be negated or not. Default is false.multiline.negate: true # 是否匹配pattern的情况# Match can be set to "after" or "before". It is used to define if lines should be append to a pattern# that was (not) matched before or after or as long as a pattern is not matched based on negate.# Note: After is the equivalent to previous and before is the equivalent to to next in Logstashmultiline.match: after # 将其追加到上一行之后 pattern + negate + match 组合成一条语意为: 如果匹配 YYYY-MM-DD HH:mm:ss 开头的行,则将其合并到当前行的上一行multiline.max_lines: 200 # 最多匹配多少行,如果超出最大行数,则丢弃多余的行(默认500)multiline.timeout: 6s # 一次合并事件的超时时间,默认为 5s添加上面的配置表明:非日期开头的日志 追加到 日期开头日志的后面 即:非匹配行追加到匹配行后面
核心参数是上述参数,以下是参数说明:
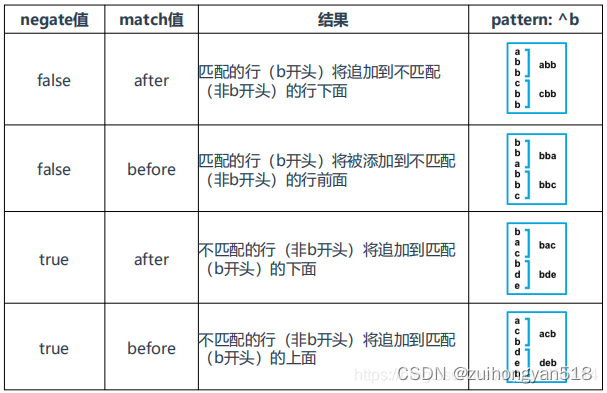
- multiline.pattern:希望匹配到的结果(正则表达式)
- multiline.negate:值为 true 或 false。使用 false 代表匹配到的行合并到上一行;使用 true 代表不匹配的行合并到上一行
- multiline.match:值为 after 或 before。after 代表合并到上一行的末尾;before 代表合并到下一行的开头
- multiline.max_lines:合并的最大行数,默认 500
- multiline.timeout:一次合并事件的超时时间,默认为 5s,防止合并消耗太多时间导致 filebeat 进程卡死
不好理解咱们整张表格,协助理解
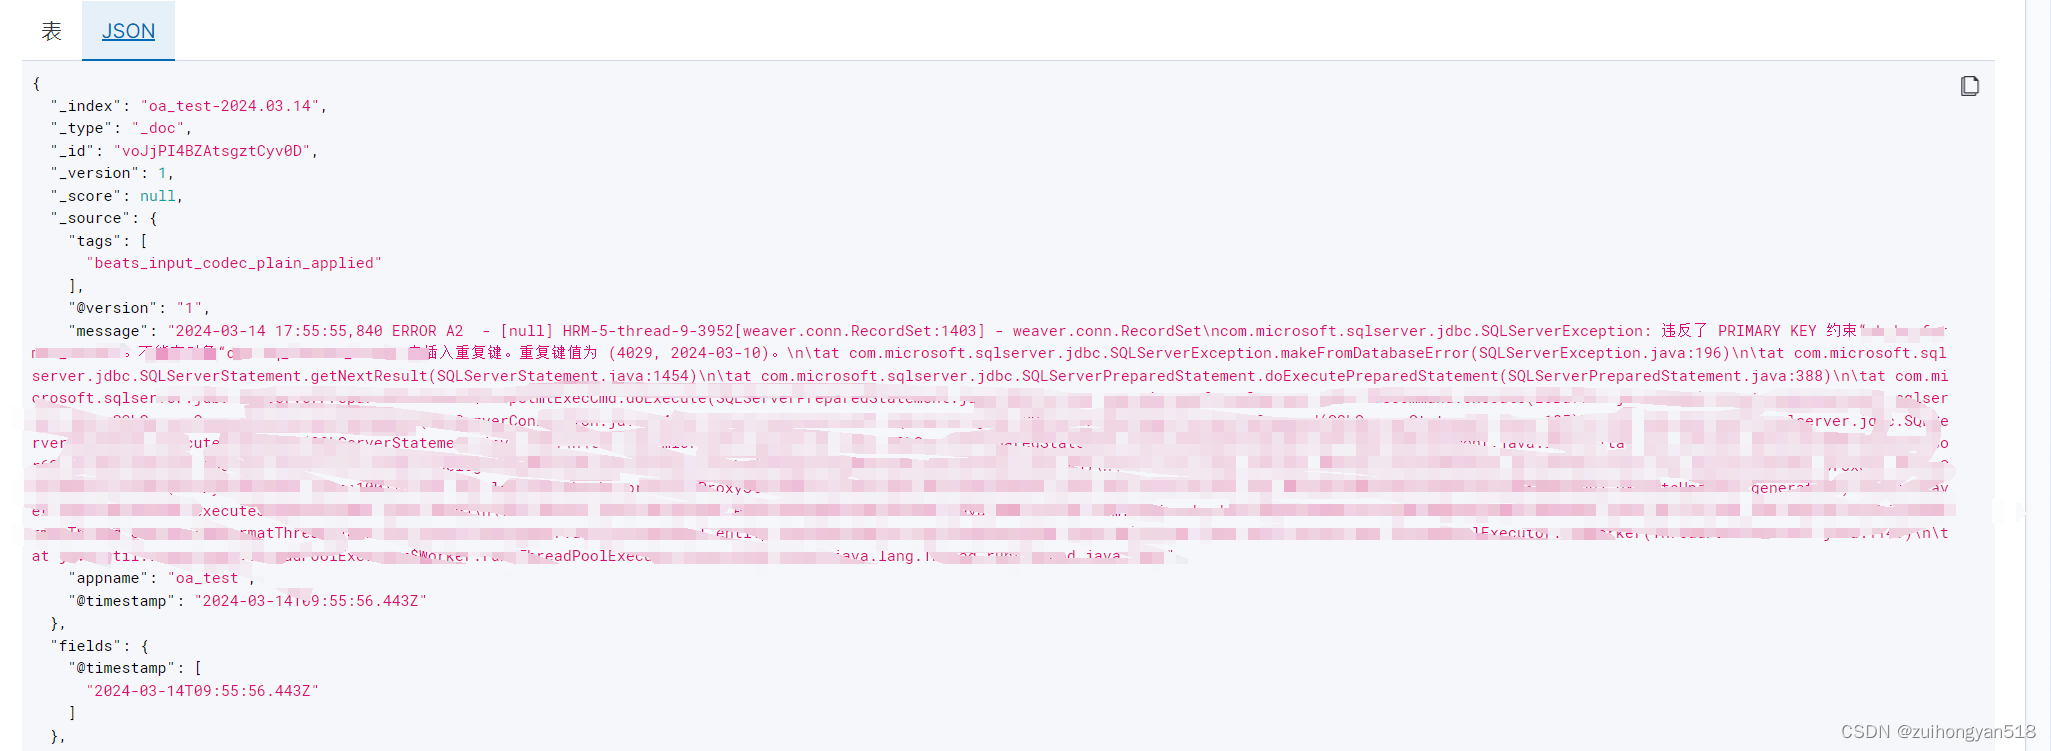
可以看到成功收集到java堆日志。
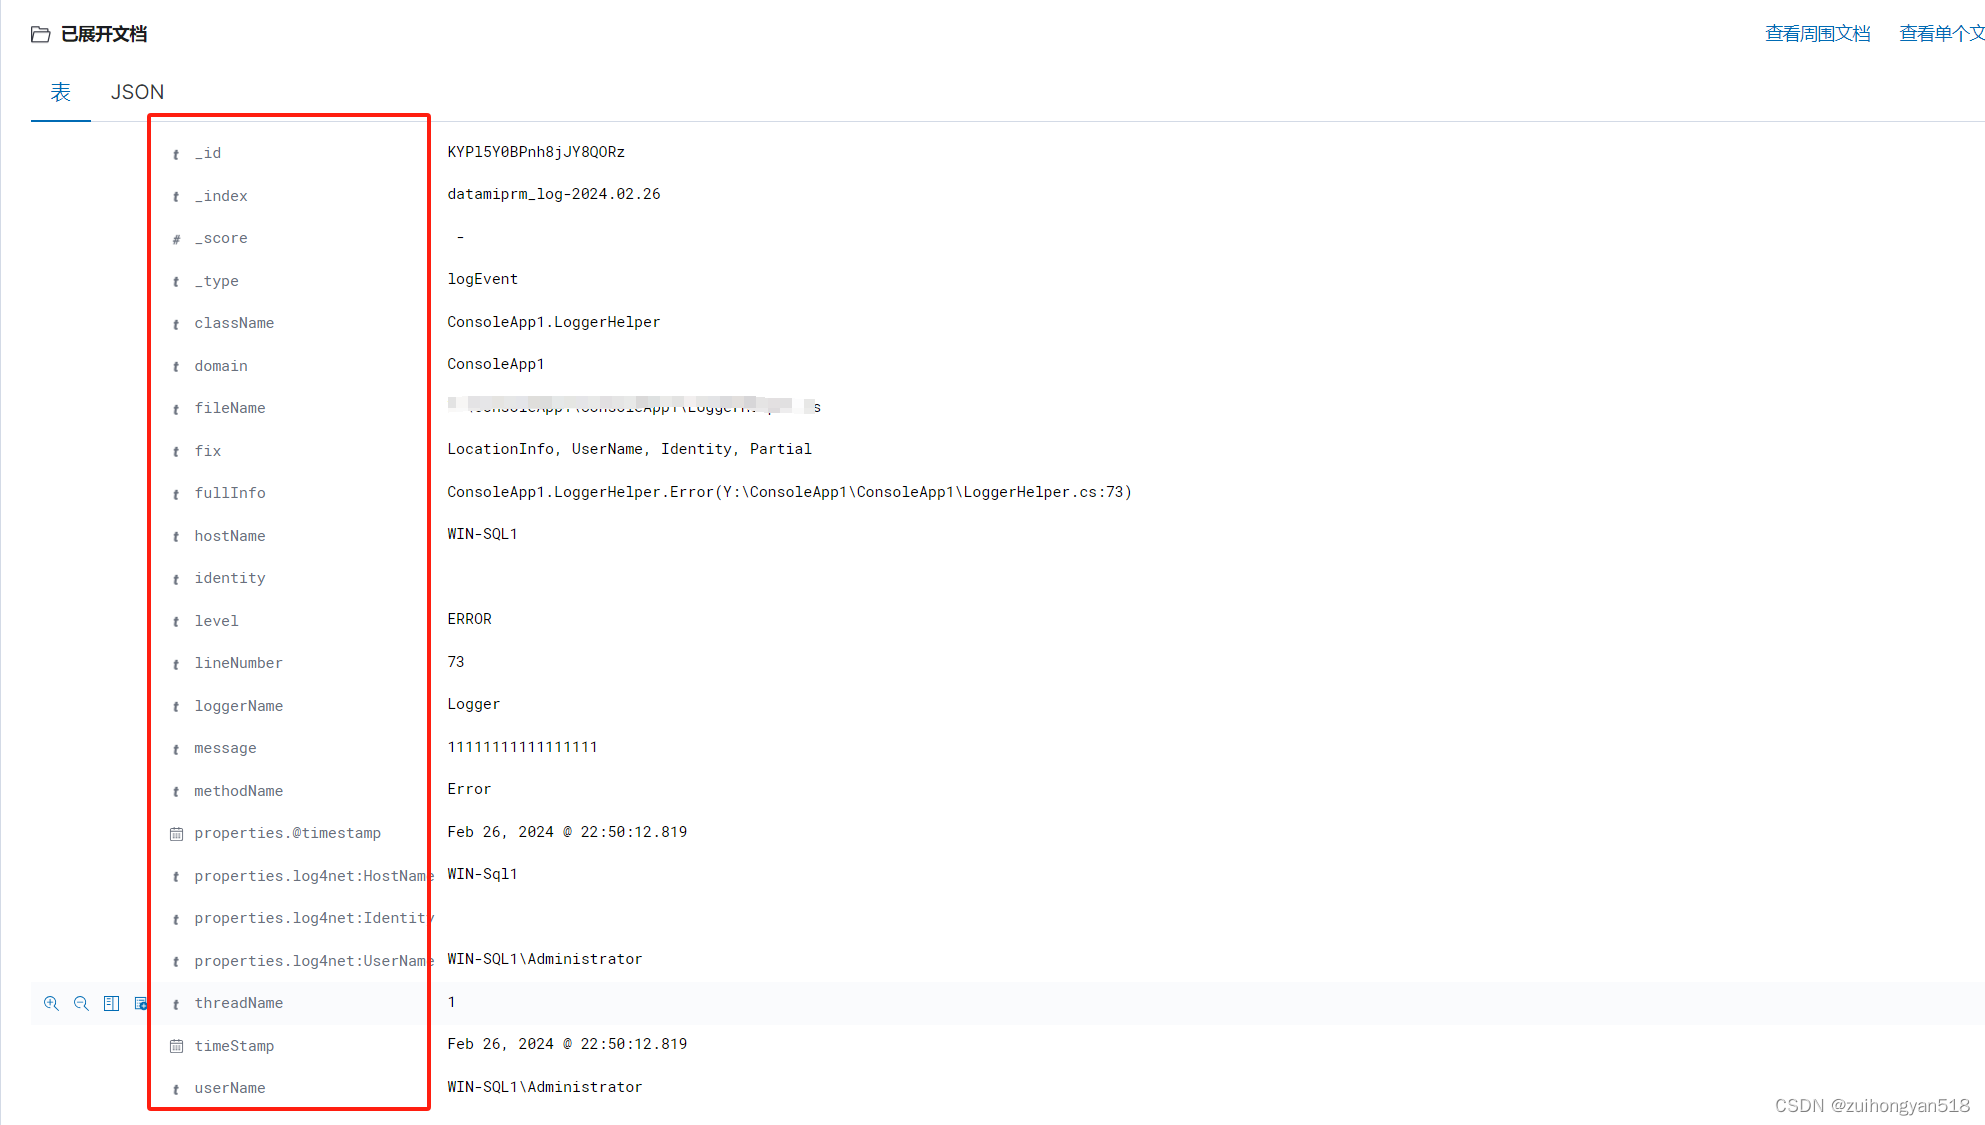
2. 去除Filebeat自带的日志字段
Filebeat自带了很多字段,都不是必须的,而且没有必要保存
添加去除Filebeat自带日志属性的配置
#================================ Processors =====================================# Configure processors to enhance or manipulate events generated by the beat.
processors:- drop_fields:fields: ["log","host","input","agent","ecs"]ignore_missing: false#- add_host_metadata: ~#- add_cloud_metadata: ~#- add_docker_metadata: ~#- add_kubernetes_metadata: ~
这个配置是 把"log","host","input","agent","ecs"等这些字段属性去除,不在日志中收集展示
添加上配置后,需要重启Filebeat。
Filebeat官方配置文档: filebeat.reference.yml | Filebeat Reference [8.12] | Elastic
这篇关于ELK之使用Filebeat插件收集日志到Logstash的文章就介绍到这儿,希望我们推荐的文章对编程师们有所帮助!


