本文主要是介绍iClient模拟疫情变化过程,希望对大家解决编程问题提供一定的参考价值,需要的开发者们随着小编来一起学习吧!
作者:lly
背景
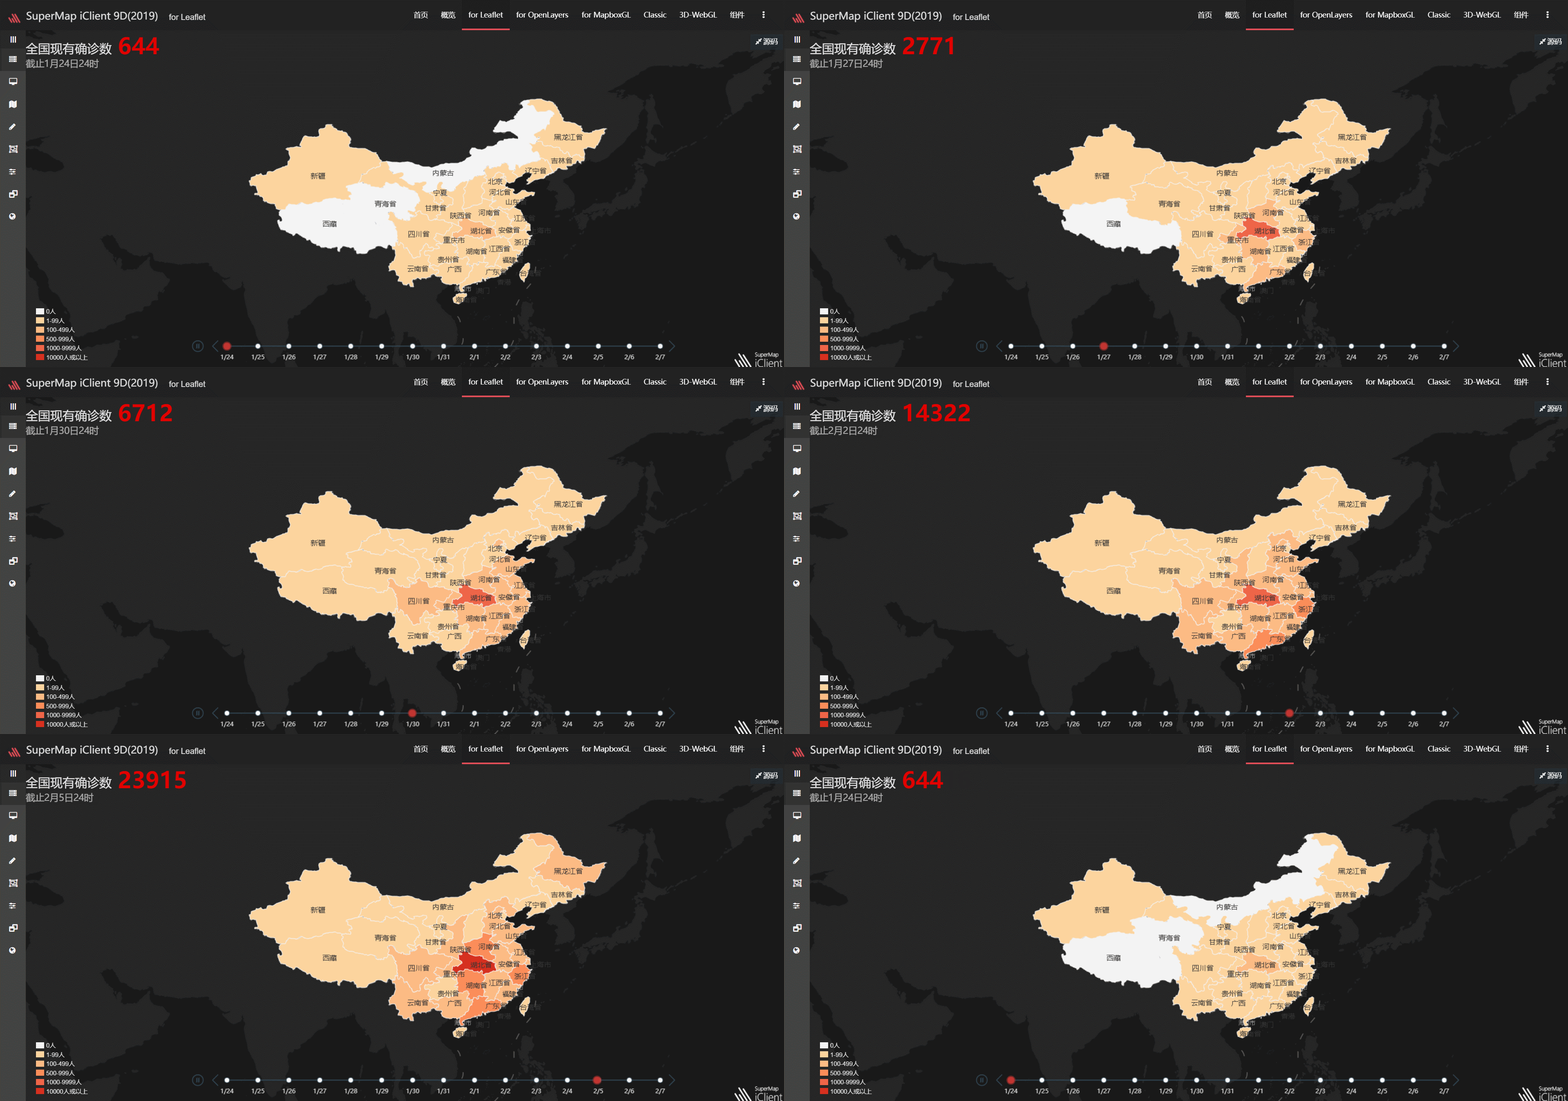
为了方便直观的了解疫情的变化过程,我们使用iClien客户端专题图来动态展示疫情的变化。
首先我们来看一看实现效果:

一、数据制作
数据需要制作为以下格式,即每天对应一个属性字段,并填充相应的数据,例:
| 行政区划 | D25 | D26 |
|---|---|---|
| 四川 | 1 | 2 |
| 湖北 | 10 | 20 |
二、字段查询
查询时间字段,用于专题图赋值
var param = new SuperMap.FieldParameters({datasource: "NCP",dataset: "China_Province_pg_1_2_1"});L.supermap.fieldService(dataUrl).getFields(param, function(serviceResult) {var innerHTML = serviceResult.result.fieldNames.join(', ');for(var i = 9; i < serviceResult.result.fieldNames.length; i++) {var monthCount=0;var dateTemp="月";var day="/"; var filed=serviceResult.result.fieldNames[i];time.push(filed);}});
三、制作专题图
使用客户端分段专题图来制作,首先初始化图层,并设置style
themeLayer = L.supermap.rangeThemeLayer("ThemeLayer", {// 开启 hover 高亮效果isHoverAble: false,opacity: 1,alwaysMapCRS: true}).addTo(map);themeLayer.style = new SuperMap.ThemeStyle({stroke: true,strokeColor: '#f4f4f4',strokeWidth: 1});// 用于单值专题图的属性字段名称themeLayer.themeField = time[0];// 风格数组,设定值对应的样式themeLayer.styleGroups = [{start: 0,end: 1,style: {color: style[0]}}, {start: 1,end: 99,style: {color: style[1]}}, {start: 99,end: 499,style: {color: style[2]}}, {start: 499,end: 999,style: {color: style[3]}}, {start: 1000,end: 9999,style: {color: style[4]}}, {start: 9999,end: 99999999999999999,style: {color: style[5]}}];
通过SQL查询数据服务,查询出行政区划面
var getFeatureBySQLParams = new SuperMap.GetFeaturesBySQLParameters({queryParameter: new SuperMap.FilterParameter({name: "China_Province_pg_1_2_1@NCP",attributeFilter: "SMID > -1"}),toIndex: 500,datasetNames: ["NCP:China_Province_pg_1_2_1"]});L.supermap.featureService(dataUrl).getFeaturesBySQL(getFeatureBySQLParams, processComplete, SuperMap.DataFormat.ISERVER);
将查询结果加到地图,并解析相应返回值用于总数显示
searchData = serviceResult;var result = serviceResult.result;var data = result.features;if(result && result.features) {themeLayer.addFeatures(result.features);var count = 0;for(var i = 0; i < result.features.length; i++) {count += Number(data[i].fieldValues[9]);}}
设置div用于制作图例
<div class="legend"><div class="content"><div class="color" style="background: rgb(244, 244, 244);"></div><div class="text">0人</div></div><div class="content"><div class="color" style="background: rgb(253, 212, 158);"></div><div class="text">1-99人</div></div><div class="content"><div class="color" style="background: rgb(253, 187, 132);"></div><div class="text">100-499人</div></div><div class="content"><div class="color" style="background: rgb(252, 141, 89);"></div><div class="text">500-999人</div></div><div class="content"><div class="color" style="background: rgb(239, 101, 72);"></div><div class="text">1000-9999人</div></div><div class="content"><div class="color" style="background: rgb(215, 48, 31);"></div><div class="text">10000人或以上</div></div></div>
css设置图例样式
.legend {position: absolute;bottom: 10px;left: 20px;z-index: 99999;}.legend .content {height: 12px;margin-bottom: 6px;}.legend .content .color {width: 16px;height: 12px;margin-bottom: -5px;}.text {position: relative;font-size: 12px;color: rgba(255, 255, 255, 0.85);margin-left: 20px;line-height: 0px;}
四、添加时间轴
var chart = echarts.init(document.getElementById("timeE"));option = {baseOption: {timeline: {axisType: 'category',autoPlay: true,currentIndex:0,playInterval: 1000,data: dataTimer,label: {formatter: function(s) {return s;},color:'#dfdfdf'}}}};chart.setOption(option);
监听时间轴改变事件,刷新专题图,并将对应统计值显示在div中
chart.on('timelinechanged', function(timeLineIndex) {themeLayer.themeField = time[timeLineIndex.currentIndex];themeLayer.redraw();var result = searchData.result;var data = result.features;if(result && result.features) {var count = 0;for(var i = 0; i < result.features.length; i++) {count += Number(data[i].fieldValues[9 + Number(timeLineIndex.currentIndex)]);}}$(".value").html(count);$(".subTitle").html("截止" + date[timeLineIndex.currentIndex])});
五、结语
至此,我们已实现全部效果,底图和标签可根据自身喜好进行更换,其中标签需新建窗格将其置于顶层,例:
map.createPane('labels');
map.getPane('labels').style.zIndex = 650;
L.supermap.tiledMapLayer(tapUrl, {transparent: true,pane: "labels"}).addTo(map);
数据及代码下载地址,提取码:zqrk
这篇关于iClient模拟疫情变化过程的文章就介绍到这儿,希望我们推荐的文章对编程师们有所帮助!


