本文主要是介绍LaTex 矢量绘图之 Tikz 代码示例汇总,希望对大家解决编程问题提供一定的参考价值,需要的开发者们随着小编来一起学习吧!
1,代码
\documentclass[]{article}
\usepackage{tikz}
\usepackage{pgfplots}
\begin{document}\begin{tikzpicture}
\draw (0,0) -- (1,1);%hello
\end{tikzpicture}\begin{tikzpicture} \draw[step=1,color=gray!40] (-2,-2) grid (2,2); \draw[->] (-3,0) -- (3,0); \draw[->] (0,-3) -- (0,3); \draw (0,0) circle (1);
\end{tikzpicture} \begin{tikzpicture} \draw[help lines] ( -5,-5 ) grid ( 5, 5);
\end{tikzpicture}\begin{tikzpicture} \draw[help lines] ( -5,-5 ) grid ( 5, 5); \draw[red] (-3,0) -- (3,0); \draw[red] (0,-3) -- (0,3); \end{tikzpicture}hello\\\begin{tikzpicture} \draw[->] (-3,3) -- (3,3); \draw[->>] (-3,2) -- (3,2); \draw[->|] (-3,1) -- (3,1); \draw[-to] (-3,0) -- (3,0); \draw[-latex] (-3,-1) -- (3,-1); \draw[-stealth] (-3,-2) -- (3,-2); \end{tikzpicture}\begin{tikzpicture} \draw[step=1,color=gray!40] (-2,-2) grid (2,2); \draw[->] (-3,0) -- (3,0); \draw[->] (0,-3) -- (0,3); \draw (0,0) circle (1); \end{tikzpicture}\begin{tikzpicture} \draw[step=1,color=gray!40] (-2,-2) grid (2,2); \draw[->] (-3,0) -- (3,0); \draw[->] (0,-3) -- (0,3); \draw (0,0) ellipse (1 and 0.5); \end{tikzpicture}\begin{tikzpicture}\draw[step=1,color=gray!40] (-2,-2) grid (2,2);\draw[->] (-3,0) -- (3,0);\draw[->] (0,-3) -- (0,3);\draw[color=gray!40] (0,0) circle (1); %\draw[color=red] (1,0) arc (0:45:1);\draw[color=gray!40] (0,0) ellipse (1 and 0.5);\draw[color=green] (1,0) arc (0:60:1 and 0.5);\end{tikzpicture}\begin{tikzpicture}[scale=2]\draw[step=1,color=gray!40] (-2,-2) grid (2,2);\draw[color=red] (-1,-1) rectangle (1,1);\end{tikzpicture}hello\\\\\\\begin{tikzpicture}\draw[step=1,color=gray!40] (-2,-2) grid (2,2);\path (1,1) coordinate (p1);\coordinate (p2) at ( 2, 0);\draw[dotted, red] (p1) -- (p2) ;\end{tikzpicture}\begin{tikzpicture}[scale=2]\draw[step=1,color=gray!40] (-2,-2) grid (2,2);\draw[latex-latex, red] (0,-2) -- ++(-1,1) -- ++(-1,-1);\draw[dashed, blue] (0,1) -- +(-1,1) -- +(-2,0);\end{tikzpicture}
\\\\\\\\testtt\\\\\\\\\begin{tikzpicture} \node (node001) at (0,2) [draw] {test}; \end{tikzpicture}\begin{tikzpicture} \node (node001) at (0,2) [draw] {node001}; \node (node002) at (-2,0) [draw] {node002}; \node (node003) at (2,0) [draw] {node003}; \draw (node cs:name=node003,anchor=north) |- (0,1); \draw (node002.north) |- (0,1) -| (node cs:name=node001,anchor=south); \end{tikzpicture}
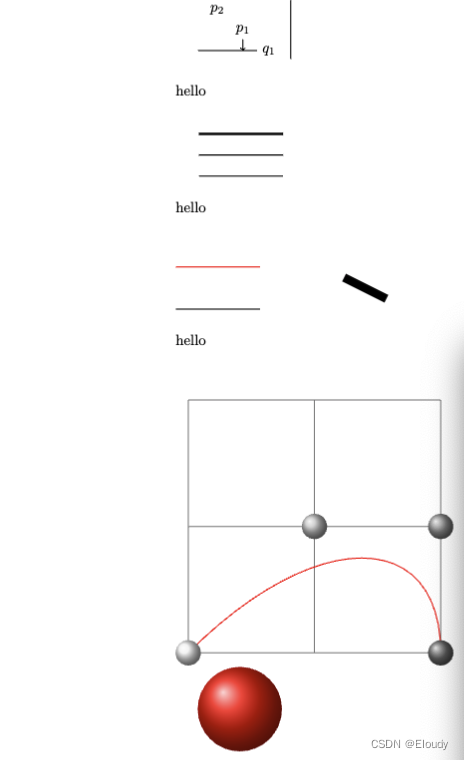
\\\\good testtt\\\\\\\\\begin{tikzpicture} \node (p1) at (30:1) {$p_1$} ; \node (p2) at (75:1) {$p_2$} ; \draw (-0.2,0) -- (1.2,0) node[right] (xline) {$q_1$}; \draw (2,-0.2) -- (2,1.2) node[above] (yline) {$q_2$}; \draw[->] (p1) -- (p1 |- xline); \end{tikzpicture}\begin{tikzpicture} \node (p1) at (30:1) {$p_1$} ; \node (p2) at (75:1) {$p_2$} ; \draw (-0.2,0) -- (1.2,0) node[right] (xline) {$q_1$}; \draw (2,-0.2) -- (2,1.2) node[above] (yline) {$q_2$}; \draw[->] (p1) -- (p1 |- xline); \end{tikzpicture}
\\\\hello\\\\\begin{tikzpicture} \draw [ultra thick] (0,1) -- (2,1); \draw [thick] (0,0.5) -- (2,0.5); \draw [thin] (0,0) -- (2,0); \end{tikzpicture}
\\\\hello\\\\\\\\\begin{tikzpicture} \draw [line width=0.4pt] (0,0) -- (2,0); \draw[red] (0,1) -- (2,1); \draw [line width=0.2cm] (4,.75) -- (5,.25); \end{tikzpicture}
\\\\hello\\\\\\\\\begin{tikzpicture}[scale=3] \draw[help lines] (0,0) grid (2,2); \draw[color=red] (0,0) .. controls (1,1) and (2,1) .. (2,0); \shade[ball color=gray!10] (0,0) circle (0.1); \shade[ball color=gray!40] (1,1) circle (0.1); \shade[ball color=gray!70] (2,1) circle (0.1); \shade[ball color=gray] (2,0) circle (0.1); \end{tikzpicture}\begin{tikzpicture} \shade[ball color=red] (1,2) circle (1); \end{tikzpicture}
\\\\hello\\\\\\\\
\begin{tikzpicture}[outline/.style={draw=#1,thick,fill=#1!50},outline/.default=black]\node [outline]at (0,1) {default};\node [outline=blue] at (0,0) {blue};\end{tikzpicture}
\\\\hello\\\\\\\\
\usetikzlibrary{positioning}
\tikzset{place/.style={circle,draw=blue!50,fill=blue!20,
thick,inner sep=0pt,minimum size=6mm}}
\tikzset{transition/.style={rectangle,draw=black!50,
fill=black!20,thick,inner sep=0pt,minimum size=4mm}}
\tikzset{every label/.style=red}
\begin{tikzpicture}[bend angle=45]
\node[place] (waiting) {};
\node[place] (critical) [below=of waiting] {};
\node[place](semaphore) [below=of critical,label=above:$s\le3$] {};
\node[transition](leave critical) [right=of critical]{};
\node[transition] (enter critical)[left=of critical]{};
\draw [->] (enter critical) to (critical);
\draw [->] (waiting) to [bend right] (enter critical);
\draw [->] (enter critical) to [bend right] (semaphore);
\draw [->] (semaphore) to [bend right] (leave critical);
\draw [->] (critical) to (leave critical);
\draw [->] (leave critical) to [bend right] (waiting);
\end{tikzpicture}
\\\\hello\\\\\\\\
\begin{tikzpicture}\draw[help lines] (0,0) grid (3,2);\foreach \x in {0,1,...,4}\draw[xshift=\x cm] (0,-1) -- (0,1);\end{tikzpicture}
\\\\hello\\\\\\\\
\begin{tikzpicture} \draw[help lines] (0,0) grid (3,2); \draw (0,0) -- (1,1); \draw[red] (0,0) -- ([xshift=1cm] 1,1); \end{tikzpicture}
\\\\hello\\\\\\\\
\begin{tikzpicture} \draw (0,0)[rotate=30] ellipse (2 and 1); \end{tikzpicture}
\\\\hello\\\\\\\\
\begin{tikzpicture}
\begin{axis}
\addplot{x*2};
\end{axis}
\end{tikzpicture}
\\\\hello\\\\\\\\
\begin{tikzpicture}\begin{axis} \addplot coordinates {(0,0) (1,1) (2,3) (3,9)}; \end{axis}\end{tikzpicture}
\\\\hello\\\\\\\\
\\\\hello\\\\\\\\
\\\\hello\\\\\\\\
\\\\hello\\\\\\\\
\\\\hello\\\\\\\\
\\\\hello\\\\\\\\
\\\\hello\\\\\\\\
\\\\hello\\\\\\\\
\\\\hello\\\\\\\\\end{document}2,效果示例
这篇关于LaTex 矢量绘图之 Tikz 代码示例汇总的文章就介绍到这儿,希望我们推荐的文章对编程师们有所帮助!


