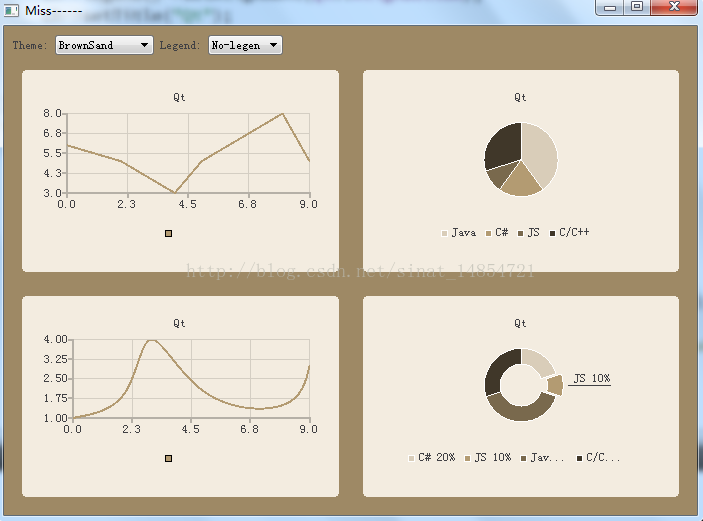
本文主要是介绍Qt QChart 图形可视化,希望对大家解决编程问题提供一定的参考价值,需要的开发者们随着小编来一起学习吧!
具体过程就不仔细说了。会在代码中讲解。
头文件:
#define YANGSEN_H
#include<QWidget>
#include<QGridLayout>
#include <QtWidgets/QApplication>
#include <QtWidgets/QMainWindow>
#include <QtCharts/QChartView>
#include <QtCharts/QLineSeries>
#include <QDebug>
#include<QPieSeries>
#include<QComboBox>
QT_CHARTS_USE_NAMESPACE
class yangsen:public QWidget
{
Q_OBJECT
public:
explicit yangsen(QWidget *parent = 0);
QGridLayout *grid;
QChartView *view;
QChart *show();//显示折线图
QChart *show1();//显示扇形图
QChart *show2();//设置曲线图
QChart *showdcout();//设置圆饼
QComboBox *ComBox;
QComboBox *combox1;
QVector<QChartView*>viewlist;
public slots:
void change();//设置标签函数
void change1();//设置主题函数
};
#endif // YANGSEN_H
源文件:
#include"yangsen.h"
#include <QtWidgets/QApplication>
#include <QtWidgets/QMainWindow>
#include <QtCharts/QChartView>
#include <QtCharts/QLineSeries>
#include <QDebug>
#include<QPieSeries>
#include<QVector>
#include<QSplineSeries>
#include<QHBoxLayout>
#include<QVBoxLayout>
#include<QLabel>
QT_CHARTS_USE_NAMESPACE
yangsen::yangsen(QWidget *widget):QWidget(widget)
{
//初始化下拉框,label
ComBox=new QComboBox;
ComBox->addItem("No-legen");
ComBox->addItem("left");
ComBox->addItem("right");
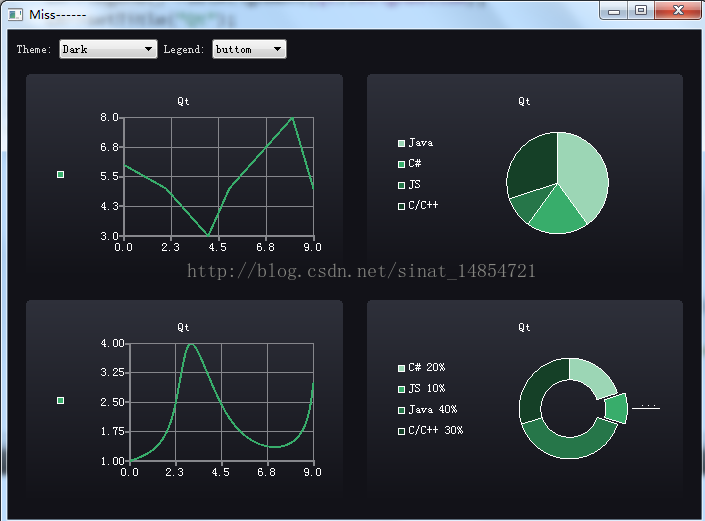
ComBox->addItem("buttom");
QHBoxLayout *hb=new QHBoxLayout;
QLabel *label1=new QLabel("Theme:");
combox1=new QComboBox;
combox1->addItem("BlueCerulean");
combox1->addItem("BlueIcy");
combox1->addItem("BrownSand");
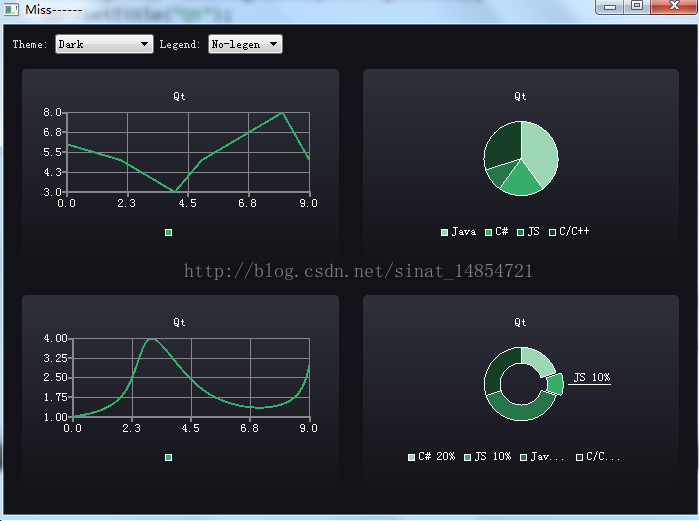
combox1->addItem("Dark");
QLabel *label=new QLabel("Legend:");
hb->addWidget(label1);
hb->addWidget(combox1);
hb->addWidget(label);
hb->addWidget(ComBox);
//增加间距之间的可延展性。
hb->addStretch();
//两个下拉框对应的槽函数
connect(ComBox,SIGNAL(currentTextChanged(QString)),this,SLOT(change()));
connect(combox1,SIGNAL(currentTextChanged(QString)),this,SLOT(change1()));
grid=new QGridLayout;
//往画布中添加折线图
view=new QChartView(show());
viewlist<<view;
grid->addWidget(view,1,0);
//往画布中添加扇形图
view=new QChartView(show1());
viewlist<<view;
grid->addWidget(view,1,1);
//往画布中添加曲线图
view=new QChartView(show2());
grid->addWidget(view,2,0);
viewlist<<view;
//往画布中添加圆饼图
view=new QChartView(showdcout());
grid->addWidget(view,2,1);
viewlist<<view;
grid->addLayout(hb,0,0,1,2);
setLayout(grid);
}
QChart* yangsen::show()
{
QLineSeries *series=new QLineSeries;
*series<<QPointF(0, 6)<<QPointF(2,5)<<QPointF(4,3)<<QPointF(5,5)<<QPointF(8,8)<<QPointF(9,5);
QChart *ch=new QChart;
ch->addSeries(series);
ch->createDefaultAxes();
ch->legend()->setAlignment(Qt::AlignBottom);
ch->setTitle("Qt");
ch->setAnimationOptions(QChart::SeriesAnimations);
return ch;
}
QChart* yangsen::show1()
{
QPieSeries *pieSeries = new QPieSeries();
pieSeries->append("Java", 40);
pieSeries->append("C#", 20);
pieSeries->append("JS", 10);
pieSeries->append("C/C++", 30);
QChart *ch=new QChart;
ch->addSeries(pieSeries);
ch->createDefaultAxes();
ch->setTitle("Qt");
ch->setAnimationOptions(QChart::SeriesAnimations);
ch->legend()->setAlignment(Qt::AlignBottom);
return ch;
}
void yangsen::change()
{
QChartView *chartView;
if(ComBox->currentIndex()!=0)
{
foreach (chartView, viewlist) {
switch(ComBox->currentIndex())
{
case 1: chartView->chart()->legend()->setAlignment(Qt::AlignTop);break;
case 2: chartView->chart()->legend()->setAlignment(Qt::AlignBottom);break;
case 3: chartView->chart()->legend()->setAlignment(Qt::AlignLeft);break;
case 4: chartView->chart()->legend()->setAlignment(Qt::AlignRight);break;
}
chartView->chart()->legend()->show();
}
}
else {
viewlist.at(0)->chart()->legend()->hide();
viewlist.at(1)->chart()->legend()->hide();
viewlist.at(2)->chart()->legend()->hide();
viewlist.at(3)->chart()->legend()->hide();
}
}
QChart* yangsen::show2()
{
QSplineSeries *serial=new QSplineSeries;
*serial<<QPointF(0, 1)<<QPointF(2,2)<<QPointF(3,4)<<QPointF(5,2)<<QPointF(8,1.5)<<QPointF(9,3);
QChart *ch=new QChart;
ch->addSeries(serial);
ch->createDefaultAxes();
ch->legend()->setAlignment(Qt::AlignBottom);
ch->setTitle("Qt");
ch->setAnimationOptions(QChart::SeriesAnimations);
return ch;
}
QChart* yangsen::showdcout()
{
QPieSeries *pie=new QPieSeries;
pie->append("C# 20%", 20);
QPieSlice *slice = pie->append("JS 10%", 10);
slice->setExploded();
slice->setLabelVisible();
pie->append("Java 40%", 40);
pie->setHoleSize(0.4);
pie->append("C/C++ 30%", 30);
QChart *ch=new QChart;
ch->addSeries(pie);
ch->createDefaultAxes();
ch->legend()->setAlignment(Qt::AlignBottom);
ch->setTitle("Qt");
ch->setAnimationOptions(QChart::SeriesAnimations);
return ch;
}
void yangsen::change1()
{
QChartView *view;
//创建调色板
QPalette pal = window()->palette();
foreach(view,viewlist)
{
switch(combox1->currentIndex())
{
case 0:view->chart()->setTheme(QChart::ChartThemeBlueCerulean);
pal.setColor(QPalette::Window, QRgb(0x40434a));
pal.setColor(QPalette::WindowText, QRgb(0xd6d6d6)); break;
case 1:view->chart()->setTheme(QChart::ChartThemeBlueIcy);
pal.setColor(QPalette::Window, QRgb(0xcee7f0));
pal.setColor(QPalette::WindowText, QRgb(0x404044));break;
case 2:view->chart()->setTheme(QChart::ChartThemeBrownSand);
pal.setColor(QPalette::Window, QRgb(0x9e8965));
pal.setColor(QPalette::WindowText, QRgb(0x404044));break;
case 3:view->chart()->setTheme(QChart::ChartThemeDark);
pal.setColor(QPalette::Window, QRgb(0x121218));
pal.setColor(QPalette::WindowText, QRgb(0xd6d6d6));break;
}
}
//这句挺重要的,没有他,就相当于设置的调色板没有生成、
window()->setPalette(pal);
}main.c文件
#include <QtWidgets/QApplication>
#include <QtWidgets/QMainWindow>
#include <QtCharts/QChartView>
#include <QtCharts/QLineSeries>
#include <QDebug>
#include"yangsen.h"
QT_CHARTS_USE_NAMESPACE
int main(int argc, char *argv[])
{
QApplication a(argc, argv);
yangsen *yang=new yangsen();
QMainWindow window;
window.setCentralWidget(yang);
window.setWindowTitle("Miss------");
window.resize(600, 450);
window.show();
//![5]
return a.exec();
}
这篇关于Qt QChart 图形可视化的文章就介绍到这儿,希望我们推荐的文章对编程师们有所帮助!


