本文主要是介绍Python pandas秘籍第四、五、六章个人笔记,希望对大家解决编程问题提供一定的参考价值,需要的开发者们随着小编来一起学习吧!
关注微信公共号:小程在线

关注CSDN博客:程志伟的博客
完整脚本在公共号有链接
Python 3.7.6 (default, Jan 8 2020, 20:23:39) [MSC v.1916 64 bit (AMD64)]
Type "copyright", "credits" or "license" for more information.
IPython 7.12.0 -- An enhanced Interactive Python.
import pandas as pd
第四章
#4.1 DataFrame 中刚添加 weekday 列
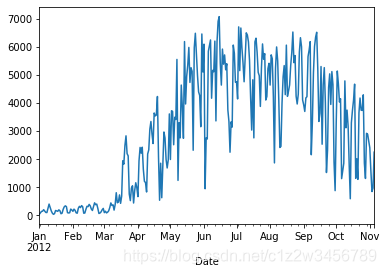
bikes = pd.read_csv('bikes.csv', sep=';', encoding='latin1', parse_dates=['Date'], dayfirst=True, index_col='Date')
bikes['Berri 1'].plot()
Out[2]: <matplotlib.axes._subplots.AxesSubplot at 0x276a4e95708>
#所以我们要创建一个只有 Berri 自行车道的 DataFrame
berri_bikes = bikes[['Berri 1']]
berri_bikes[:5]
Out[3]:
Berri 1
Date
2012-01-01 35
2012-01-02 83
2012-01-03 135
2012-01-04 144
2012-01-05 197
接下来, 我们需要添加一列 weekday 。 首先, 我们可以从索引得到星期。 我们还没有谈到索引, 但索引在上面的 DataFrame 中是左边的东西, 在 Date 下面。 它基本上是一年中的所有日子。
berri_bikes.index
Out[4]:
DatetimeIndex(['2012-01-01', '2012-01-02', '2012-01-03', '2012-01-04',
'2012-01-05', '2012-01-06', '2012-01-07', '2012-01-08',
'2012-01-09', '2012-01-10',
...
'2012-10-27', '2012-10-28', '2012-10-29', '2012-10-30',
'2012-10-31', '2012-11-01', '2012-11-02', '2012-11-03',
'2012-11-04', '2012-11-05'],
dtype='datetime64[ns]', name='Date', length=310, freq=None)
我们想得到每一行的月份中的日期, 我们可以这样做:
berri_bikes.index.day
Out[6]:
Int64Index([ 1, 2, 3, 4, 5, 6, 7, 8, 9, 10,
...
27, 28, 29, 30, 31, 1, 2, 3, 4, 5],
dtype='int64', name='Date', length=310)
我们实际上想要星期
berri_bikes.index.weekday
Out[7]:
Int64Index([6, 0, 1, 2, 3, 4, 5, 6, 0, 1,
...
5, 6, 0, 1, 2, 3, 4, 5, 6, 0],
dtype='int64', name='Date', length=310)
这是周中的日期, 其中 0 是星期一。 我通过查询日历得到 0 是星期一。
现在我们知道了如何获取星期, 我们可以将其添加到我们的 DataFrame 中作为一列:
berri_bikes['weekday'] = berri_bikes.index.weekday
berri_bikes[:5]
__main__:1: SettingWithCopyWarning:
A value is trying to be set on a copy of a slice from a DataFrame.
Try using .loc[row_indexer,col_indexer] = value instead
See the caveats in the documentation: https://pandas.pydata.org/pandas-docs/stable/user_guide/indexing.html#returning-a-view-versus-a-copy
Out[8]:
Berri 1 weekday
Date
2012-01-01 35 6
2012-01-02 83 0
2012-01-03 135 1
2012-01-04 144 2
2012-01-05 197 3
#4.2 按星期统计骑手
按星期对行分组, 然后将星期相同的所有值相加”。
weekday_counts = berri_bikes.groupby('weekday').aggregate(sum)
weekday_counts
Out[9]:
Berri 1
weekday
0 134298
1 135305
2 152972
3 160131
4 141771
5 101578
6 99310
weekday_counts.index = ['Monday', 'Tuesday', 'Wednesday', 'Thursday', 'Friday', 'Saturday', 'Sunday']
weekday_counts
Out[10]:
Berri 1
Monday 134298
Tuesday 135305
Wednesday 152972
Thursday 160131
Friday 141771
Saturday 101578
Sunday 99310
#4.3完整代码
bikes = pd.read_csv('bikes.csv',
sep=';', encoding='latin1',
parse_dates=['Date'], dayfirst=True,
index_col='Date')
# 添加 weekday 列
berri_bikes = bikes[['Berri 1']]
berri_bikes['weekday'] = berri_bikes.index.weekday
# 按照星期累计骑手, 并绘制出来
weekday_counts = berri_bikes.groupby('weekday').aggregate(sum)
weekday_counts.index = ['Monday', 'Tuesday', 'Wednesday', 'Thursday', 'Friday', 'Saturday', 'Sunday']
weekday_counts.plot(kind='bar')
第五章
因为数据原因,跳过
url_template = "http://climate.weather.gc.ca/climateData/bulkdata_e.html?format=csv&stationID=5415&Year={year}&Month={month}&timeframe=1&submit=Download+Data"
url = url_template.format(month=3, year=2012)
weather_mar2012 = pd.read_csv(url, skiprows=16, index_col='Date/Time', parse_dates=True, encoding='latin1')
weather_mar2012
Traceback (most recent call last):
File "<ipython-input-11-71520743bd8a>", line 3, in <module>
weather_mar2012 = pd.read_csv(url, skiprows=16, index_col='Date/Time', parse_dates=True, encoding='latin1')
File "E:\anaconda3\lib\site-packages\pandas\io\parsers.py", line 676, in parser_f
return _read(filepath_or_buffer, kwds)
File "E:\anaconda3\lib\site-packages\pandas\io\parsers.py", line 431, in _read
filepath_or_buffer, encoding, compression
File "E:\anaconda3\lib\site-packages\pandas\io\common.py", line 172, in get_filepath_or_buffer
req = urlopen(filepath_or_buffer)
File "E:\anaconda3\lib\site-packages\pandas\io\common.py", line 141, in urlopen
return urllib.request.urlopen(*args, **kwargs)
File "E:\anaconda3\lib\urllib\request.py", line 222, in urlopen
return opener.open(url, data, timeout)
File "E:\anaconda3\lib\urllib\request.py", line 531, in open
response = meth(req, response)
File "E:\anaconda3\lib\urllib\request.py", line 641, in http_response
'http', request, response, code, msg, hdrs)
File "E:\anaconda3\lib\urllib\request.py", line 563, in error
result = self._call_chain(*args)
File "E:\anaconda3\lib\urllib\request.py", line 503, in _call_chain
result = func(*args)
File "E:\anaconda3\lib\urllib\request.py", line 755, in http_error_302
return self.parent.open(new, timeout=req.timeout)
File "E:\anaconda3\lib\urllib\request.py", line 531, in open
response = meth(req, response)
File "E:\anaconda3\lib\urllib\request.py", line 641, in http_response
'http', request, response, code, msg, hdrs)
File "E:\anaconda3\lib\urllib\request.py", line 569, in error
return self._call_chain(*args)
File "E:\anaconda3\lib\urllib\request.py", line 503, in _call_chain
result = func(*args)
File "E:\anaconda3\lib\urllib\request.py", line 649, in http_error_default
raise HTTPError(req.full_url, code, msg, hdrs, fp)
HTTPError: Not Found
第六章
import pandas as pd
weather_2012 = pd.read_csv('weather_2012.csv', parse_dates=True, index_col='Date/Time')
weather_2012[:5]
Out[20]:
Temp (C) ... Weather
Date/Time ...
2012-01-01 00:00:00 -1.8 ... Fog
2012-01-01 01:00:00 -1.8 ... Fog
2012-01-01 02:00:00 -1.8 ... Freezing Drizzle,Fog
2012-01-01 03:00:00 -1.5 ... Freezing Drizzle,Fog
2012-01-01 04:00:00 -1.5 ... Fog
[5 rows x 7 columns]
#6.1 字符串操作
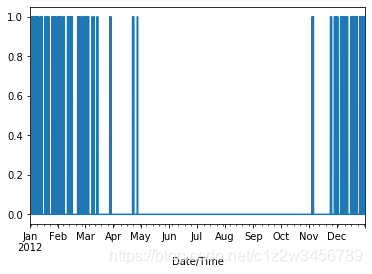
weather_description = weather_2012['Weather']
is_snowing = weather_description.str.contains('Snow')
is_snowing[:5]
Out[21]:
Date/Time
2012-01-01 00:00:00 False
2012-01-01 01:00:00 False
2012-01-01 02:00:00 False
2012-01-01 03:00:00 False
2012-01-01 04:00:00 False
Name: Weather, dtype: bool
is_snowing.plot()
Traceback (most recent call last):
File "<ipython-input-22-fffdae324377>", line 1, in <module>
is_snowing.plot()
File "E:\anaconda3\lib\site-packages\pandas\plotting\_core.py", line 847, in __call__
return plot_backend.plot(data, kind=kind, **kwargs)
File "E:\anaconda3\lib\site-packages\pandas\plotting\_matplotlib\__init__.py", line 61, in plot
plot_obj.generate()
File "E:\anaconda3\lib\site-packages\pandas\plotting\_matplotlib\core.py", line 261, in generate
self._compute_plot_data()
File "E:\anaconda3\lib\site-packages\pandas\plotting\_matplotlib\core.py", line 410, in _compute_plot_data
raise TypeError("no numeric data to plot")
TypeError: no numeric data to plot
解决方法:
is_snowing.astype(float).plot()
Out[23]: <matplotlib.axes._subplots.AxesSubplot at 0x276a63ae508>
#6.2 使用 resample 找到下雪最多的月份
import numpy as np
weather_2012['Temp (C)'].resample('M', how=np.median).plot(kind='bar')
Traceback (most recent call last):
File "<ipython-input-26-59c50ec9a1b7>", line 1, in <module>
weather_2012['Temp (C)'].resample('M', how=np.median).plot(kind='bar')
TypeError: resample() got an unexpected keyword argument 'how'
weather_2012['Temp (C)'].resample('M').median().plot(kind='bar')
Out[30]: <matplotlib.axes._subplots.AxesSubplot at 0x276a6427448>
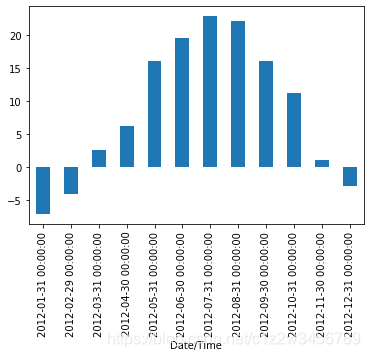
毫无奇怪, 七月和八月是最暖和的。
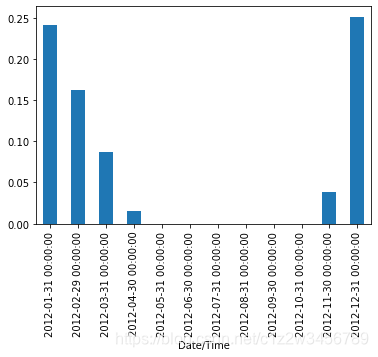
然后使用 resample 寻找每个月下雪的时间比例。
is_snowing.astype(float).resample('M').mean()
Out[7]:
Date/Time
2012-01-31 0.240591
2012-02-29 0.162356
2012-03-31 0.087366
2012-04-30 0.015278
2012-05-31 0.000000
2012-06-30 0.000000
2012-07-31 0.000000
2012-08-31 0.000000
2012-09-30 0.000000
2012-10-31 0.000000
2012-11-30 0.038889
2012-12-31 0.251344
Freq: M, Name: Weather, dtype: float64
is_snowing.astype(float).resample('M').mean().plot(kind='bar')
Out[8]: <matplotlib.axes._subplots.AxesSubplot at 0x22a7042d488>
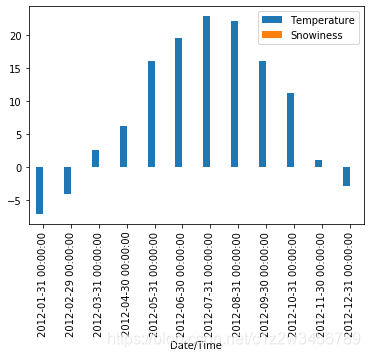
#6.3 将温度和降雪绘制在一起
temperature = weather_2012['Temp (C)'].resample('M').median()
is_snowing = weather_2012['Weather'].str.contains('Snow')
snowiness = is_snowing.astype(float).resample('M').median()
temperature.name = "Temperature"
snowiness.name = "Snowiness"
stats = pd.concat([temperature, snowiness], axis=1)
stats
Out[16]:
Temperature Snowiness
Date/Time
2012-01-31 -7.05 0.0
2012-02-29 -4.10 0.0
2012-03-31 2.60 0.0
2012-04-30 6.30 0.0
2012-05-31 16.05 0.0
2012-06-30 19.60 0.0
2012-07-31 22.90 0.0
2012-08-31 22.20 0.0
2012-09-30 16.10 0.0
2012-10-31 11.30 0.0
2012-11-30 1.05 0.0
2012-12-31 -2.85 0.0
stats.plot(kind='bar')
Out[17]: <matplotlib.axes._subplots.AxesSubplot at 0x22a72571688>
stats.plot(kind='bar', subplots=True, figsize=(15, 10))
Out[18]:
array([<matplotlib.axes._subplots.AxesSubplot object at 0x0000022A7254CEC8>,
<matplotlib.axes._subplots.AxesSubplot object at 0x0000022A722C0E08>],
dtype=object)


这篇关于Python pandas秘籍第四、五、六章个人笔记的文章就介绍到这儿,希望我们推荐的文章对编程师们有所帮助!


