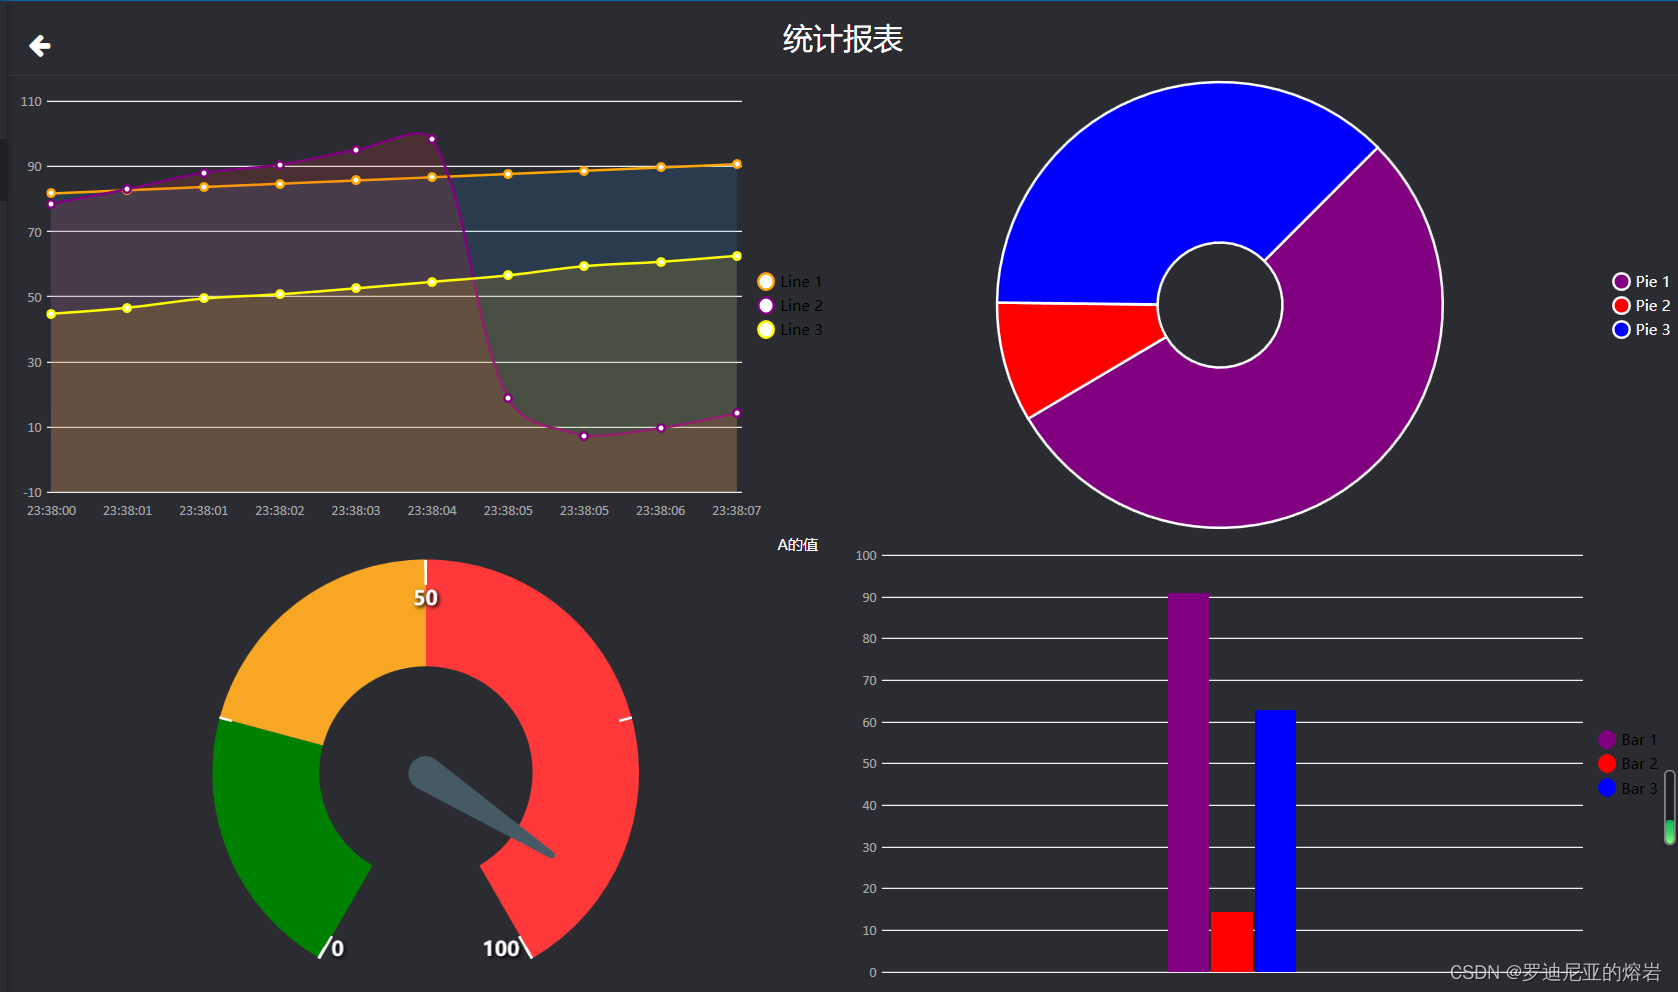
本文主要是介绍WPF中,利用Livechart使用动态图表,希望对大家解决编程问题提供一定的参考价值,需要的开发者们随着小编来一起学习吧!
ViewModel利用消息机制从MainViewModel读取PLC的动态数值:
using CommunityToolkit.Mvvm.ComponentModel;
using CommunityToolkit.Mvvm.Messaging;
using CommunityToolkit.Mvvm.Messaging.Messages;
using Kx.Service.Entry;
using Kx.Utils;
using LiveCharts;
using LiveCharts.Defaults;
using LiveCharts.Wpf;
using System;
using System.Collections.Generic;
using System.Collections.ObjectModel;
using System.Linq;
using System.Text;
using System.Threading.Tasks;
using System.Windows;
using System.Windows.Media;
using System.Windows.Threading;namespace Kx.ViewModel
{public class Index1ViewModel : ObservableRecipient, IRecipient<PropertyChangedMessage<string>>{public Index1ViewModel(MyS7Entry myS7Entry){IsActive = true;#region 饼状图CotrPieValues = new SeriesCollection();InitializePieData();#endregion#region 柱状图2CtorBarChartSeries = new SeriesCollection();InitializeBarData();#endregion#region 折线图CtorInitializeLineData();this.myS7Entry = myS7Entry;#endregion//uiDispatcher = Dispatcher.CurrentDispatcher;//uiDispatcher = Application.Current.Dispatcher;//Application.Current.Dispatcher.BeginInvoke//Task.Run(async () =>//{//    while (true)//    {//        await Task.Delay(1000);//        await myObject.Dispatcher.BeginInvoke(new Action(() =>//        {//            var random = new Random();//            A = random.Next(1, 100);//            B = random.Next(1, 100);//            C = random.Next(1, 100);//        }));//    }//});}private double a = 2;public double A{get => a;set{if (SetProperty(ref a, value)){UpdatePieData();UpdateBarData();UpdateLineData();}}}private double b = 3;public double B{get => b;set{if (SetProperty(ref b, value)){}}}private double c = 4;public double C{get => c;set{if (SetProperty(ref c, value)){}}}#region 柱状图2private SeriesCollection barChartSeries = new();public SeriesCollection BarChartSeries{get => barChartSeries;set => SetProperty(ref barChartSeries, value);}private ObservableCollection<string> barChartLabels;/// <summary>/// X轴标签/// </summary>public ObservableCollection<string> BarChartLabels{get => barChartLabels;set => SetProperty(ref barChartLabels, value);}private void InitializeBarData(){// 初始化柱状图数据var initialValues = new List<double> { A, B, C };var initialColors = new List<Brush> { Brushes.Purple, Brushes.Red, Brushes.Blue };for (int i = 0; i < initialValues.Count; i++){var series = new ColumnSeries{Title = $"Bar {i + 1}",Values = new ChartValues<double>() { initialValues[i] },Fill = initialColors[i]};BarChartSeries.Add(series);}}private void UpdateBarData(){var series0 = BarChartSeries[0] as ColumnSeries;var series1 = BarChartSeries[1] as ColumnSeries;var series2 = BarChartSeries[2] as ColumnSeries;series0.Values[0] = A;series1.Values[0] = B;series2.Values[0] = C;//var random = new Random();//for (int i = 0; i < BarChartSeries.Count; i++)//{//    var series = BarChartSeries[i] as ColumnSeries;//    if (series != null)//    {//        series.Values[0] = (double)random.Next(1, 100); // 将整数转换为双精度浮点数//    }//}}#endregion#region 饼图private void InitializePieData(){// 初始化饼图数据var initialValues = new List<double> { A, B, C };var initialColors = new List<Brush> { Brushes.Purple, Brushes.Red, Brushes.Blue };for (int i = 0; i < initialValues.Count; i++){var series = new PieSeries{Title = $"Pie {i + 1}",Values = new ChartValues<double> { initialValues[i] },Fill = initialColors[i]};PieValues.Add(series);}}private void UpdatePieData(){var series0 = PieValues[0] as PieSeries;var series1 = PieValues[1] as PieSeries;var series2 = PieValues[2] as PieSeries;series0.Values[0] = A;series1.Values[0] = B;series2.Values[0] = C;}//private void UpdatePieData()//{//    var random = new Random();//    for (int i = 0; i < PieValues.Count; i++)//    {//        var series = PieValues[i] as PieSeries;//        if (series != null)//        {//            series.Values[0] = (double)random.Next(1, 100); // 将整数转换为双精度浮点数//        }//    }//}private SeriesCollection pieValues;public SeriesCollection PieValues{get => pieValues;set => SetProperty(ref pieValues, value);}#endregion#region 折线图private SeriesCollection lineSeries = new();public SeriesCollection LineSeries{get => lineSeries;set => SetProperty(ref lineSeries, value);}private void InitializeLineData(){// 初始化折线图数据var initialValues = new List<double> { A, B, C};var initialColors = new List<Brush> { Brushes.Orange, Brushes.Purple, Brushes.Yellow };for (int i = 0; i < 3; i++){var series = new LineSeries{Title = $"Line {i + 1}",Values = new ChartValues<double>(),Stroke = initialColors[i],Fill = null};LineSeries.Add(series);}}private void UpdateLineData(){var series0 = LineSeries[0] as LineSeries;var series1 = LineSeries[1] as LineSeries;var series2 = LineSeries[2] as LineSeries;series0.Values.Add(A);series1.Values.Add(B);series2.Values.Add(C);XAxisLabels.Add(DateTime.Now.ToString("HH:mm:ss"));if (series0.Values.Count>10){series0.Values.RemoveAt(0);}if (series1.Values.Count > 10){series1.Values.RemoveAt(0);}if (series2.Values.Count > 10){series2.Values.RemoveAt(0);}if (XAxisLabels.Count > 10){XAxisLabels.RemoveAt(0);}}private ChartValues<double> lineChartValuesA = new();public ChartValues<double> LineChartValuesA { get=>lineChartValuesA; set=>SetProperty(ref lineChartValuesA,value); }private ChartValues<double> lineChartValuesB = new();public ChartValues<double> LineChartValuesB{get => lineChartValuesB;set => SetProperty(ref lineChartValuesB, value);}private ChartValues<double> lineChartValuesC = new();public ChartValues<double> LineChartValuesC{get => lineChartValuesC;set => SetProperty(ref lineChartValuesC, value);}private ObservableCollection<string> xAxisLabels= new();public ObservableCollection<string> XAxisLabels{get => xAxisLabels;set => SetProperty(ref xAxisLabels, value);}#endregionprivate Dispatcher uiDispatcher;private MyDispatcherObject myObject = new();private readonly MyS7Entry myS7Entry;private SolidColorBrush GetRandomBrush(){Random random = new Random();byte[] rgb = new byte[3];random.NextBytes(rgb);SolidColorBrush brush = new SolidColorBrush(Color.FromRgb(rgb[0], rgb[1], rgb[2]));return brush;}public void Receive(PropertyChangedMessage<string> message){//MessageBox.Show("传送成功!");if (message.Sender is MyMainViewModel mainVm){Application.Current.Dispatcher.BeginInvoke(new Action(() =>{A = myS7Entry.MyShort1;B = myS7Entry.MyShort2;C = myS7Entry.MyShort3;}));}}}
}
前端:
<UserControlx:Class="Kx.View.IndexView1"xmlns="http://schemas.microsoft.com/winfx/2006/xaml/presentation"xmlns:x="http://schemas.microsoft.com/winfx/2006/xaml"xmlns:d="http://schemas.microsoft.com/expression/blend/2008"xmlns:hc="https://handyorg.github.io/handycontrol"xmlns:local="clr-namespace:Kx.View"xmlns:mc="http://schemas.openxmlformats.org/markup-compatibility/2006"xmlns:mv="clr-namespace:Kx.ViewModel"xmlns:util="clr-namespace:Kx.Utils"xmlns:wpf="clr-namespace:LiveCharts.Wpf;assembly=LiveCharts.Wpf"d:DataContext="{d:DesignInstance mv:Index1ViewModel}"d:DesignHeight="450"d:DesignWidth="800"mc:Ignorable="d"><UserControl.Resources><util:ChartValuesToBrushesConverter x:Key="ChartValuesToBrushesConverter" /><util:ValueToColorConverter x:Key="ValueToColorConverter" /><SolidColorBrush x:Key="YellowBrush" Color="Yellow" /><SolidColorBrush x:Key="RedBrush" Color="Red" /></UserControl.Resources><Grid><Grid.RowDefinitions><RowDefinition Height="60" /><RowDefinition /></Grid.RowDefinitions><Border BorderBrush="#383839" BorderThickness="0,0,0,1"><TextBlockHorizontalAlignment="Center"VerticalAlignment="Center"FontSize="24"Foreground="White"Text="统计报表" /></Border><Grid Grid.Row="1"><Grid.RowDefinitions><RowDefinition /><RowDefinition /></Grid.RowDefinitions><Grid.ColumnDefinitions><ColumnDefinition /><ColumnDefinition /></Grid.ColumnDefinitions><!--<wpf:CartesianChartGrid.Row="1"Grid.Column="0"Margin="10"><wpf:CartesianChart.Series><wpf:ColumnSeries Values="{Binding BarChartValues, Mode=TwoWay}" Fill="{Binding BarChartColors}"/></wpf:CartesianChart.Series><wpf:CartesianChart.AxisX><wpf:Axis Labels="{Binding BarChartLabels}" ShowLabels="True"><wpf:Axis.Separator><wpf:Separator IsEnabled="False" Step="1"  StrokeThickness="0"/></wpf:Axis.Separator></wpf:Axis></wpf:CartesianChart.AxisX></wpf:CartesianChart>--><!--<wpf:CartesianChart Grid.Row="1"Grid.Column="0"Margin="10"Series="{Binding BarChartSeries}"><wpf:CartesianChart.AxisX><wpf:Axis Labels="{Binding BarChartLabels}" ShowLabels="True"><wpf:Axis.Separator><wpf:Separator IsEnabled="False" Step="1"  StrokeThickness="0"/></wpf:Axis.Separator></wpf:Axis></wpf:CartesianChart.AxisX></wpf:CartesianChart>--><!--<wpf:CartesianChart><wpf:CartesianChart.Series><wpf:LineSeries Title="A" Values="{Binding LineChartValuesA}" PointGeometrySize="5" /><wpf:LineSeries Title="B" Values="{Binding LineChartValuesB}" PointGeometrySize="5" /><wpf:LineSeries Title="C" Values="{Binding LineChartValuesC}" PointGeometrySize="5" /></wpf:CartesianChart.Series><wpf:CartesianChart.AxisX><wpf:Axis Title="Time" Labels="{Binding XAxisLabels}" Position="LeftBottom"/></wpf:CartesianChart.AxisX></wpf:CartesianChart>--><wpf:CartesianChartGrid.Row="0"Grid.Column="0"Margin="10"Hoverable="True"LegendLocation="Right"Series="{Binding LineSeries}"><wpf:CartesianChart.AxisX><wpf:Axis Labels="{Binding XAxisLabels}" ShowLabels="True"><wpf:Axis.Separator><wpf:SeparatorIsEnabled="False"Step="1"StrokeThickness="0" /></wpf:Axis.Separator></wpf:Axis></wpf:CartesianChart.AxisX></wpf:CartesianChart><wpf:CartesianChartGrid.Row="1"Grid.Column="1"Margin="10"Hoverable="True"LegendLocation="Right"Series="{Binding BarChartSeries}"><wpf:CartesianChart.AxisX><wpf:Axis Labels="" ShowLabels="False"><wpf:Axis.Separator><wpf:SeparatorIsEnabled="True"Step="1"StrokeThickness="0" /></wpf:Axis.Separator></wpf:Axis></wpf:CartesianChart.AxisX></wpf:CartesianChart><wpf:PieChartGrid.Row="0"Grid.Column="1"Hoverable="True"InnerRadius="50"LegendLocation="Right"Series="{Binding PieValues}"><wpf:PieChart.ChartLegend><wpf:DefaultLegend Foreground="White" /></wpf:PieChart.ChartLegend></wpf:PieChart><Grid Grid.Row="1"><Grid.RowDefinitions><RowDefinition Height="15" /><RowDefinition Height="*" /></Grid.RowDefinitions><Border><StackPanel HorizontalAlignment="Right" Orientation="Vertical"><TextBlockMargin="0,0,20,0"Foreground="White"Text="A的值" /></StackPanel></Border><Border Grid.Row="1"><wpf:AngularGaugeMargin="5"FontSize="16"FontWeight="Bold"Foreground="White"FromValue="0"LabelsStep="50"SectionsInnerRadius=".5"TicksForeground="White"TicksStep="25"ToValue="100"Wedge="300"Value="{Binding A}"><wpf:AngularGauge.Sections><wpf:AngularSectionFill="Green"FromValue="0"ToValue="25" /><wpf:AngularSectionFill="#F8A725"FromValue="25"ToValue="50" /><wpf:AngularSectionFill="#FF3939"FromValue="50"ToValue="100" /></wpf:AngularGauge.Sections></wpf:AngularGauge></Border></Grid></Grid></Grid>
</UserControl>
App:
<Applicationx:Class="Kx.App"xmlns="http://schemas.microsoft.com/winfx/2006/xaml/presentation"xmlns:x="http://schemas.microsoft.com/winfx/2006/xaml"xmlns:local="clr-namespace:Kx"Startup="Application_Startup"><Application.Resources><ResourceDictionary><ResourceDictionary.MergedDictionaries><!--  MahApps.Metro resource dictionaries. Make sure that all file names are Case Sensitive!  --><ResourceDictionary Source="pack://application:,,,/MahApps.Metro;component/Styles/Controls.xaml" /><ResourceDictionary Source="pack://application:,,,/MahApps.Metro;component/Styles/Fonts.xaml" /><!--  Theme setting  --><ResourceDictionary Source="pack://application:,,,/MahApps.Metro;component/Styles/Themes/Light.Blue.xaml" /><!--  my styles  --><ResourceDictionary Source="Resources/RadioButtonMenuDictionary.xaml" /><ResourceDictionary Source="Resources/ToggleButtonDictionary.xaml" /><ResourceDictionary Source="Resources/DataGridDictionary.xaml" /><ResourceDictionary Source="Resources/TextBlockDictionary.xaml" /><ResourceDictionary Source="Resources/LabelFontDictionary.xaml" /><ResourceDictionary Source="pack://application:,,,/HandyControl;component/Themes/SkinDefault.xaml" /><ResourceDictionary Source="pack://application:,,,/HandyControl;component/Themes/Theme.xaml" /></ResourceDictionary.MergedDictionaries><!--  public color  --><SolidColorBrush x:Key="AppBackground" Color="#2B2C31" /></ResourceDictionary></Application.Resources>
</Application>
效果:
这篇关于WPF中,利用Livechart使用动态图表的文章就介绍到这儿,希望我们推荐的文章对编程师们有所帮助!


