本文主要是介绍【附代码】使用Shapely计算点面关系,希望对大家解决编程问题提供一定的参考价值,需要的开发者们随着小编来一起学习吧!
文章目录
- 相关文献
- 基础
- 点面关系展示图
- 点面关系代码
作者:小猪快跑
基础数学&计算数学,从事优化领域5年+,主要研究方向:MIP求解器、整数规划、随机规划、智能优化算法
本文档介绍如何使用 Shapely Python 包 计算几何点面关系。
如有错误,欢迎指正。如有更好的算法,也欢迎交流!!!——@小猪快跑
相关文献
- The Shapely User Manual — Shapely 2.0.1 documentation
基础
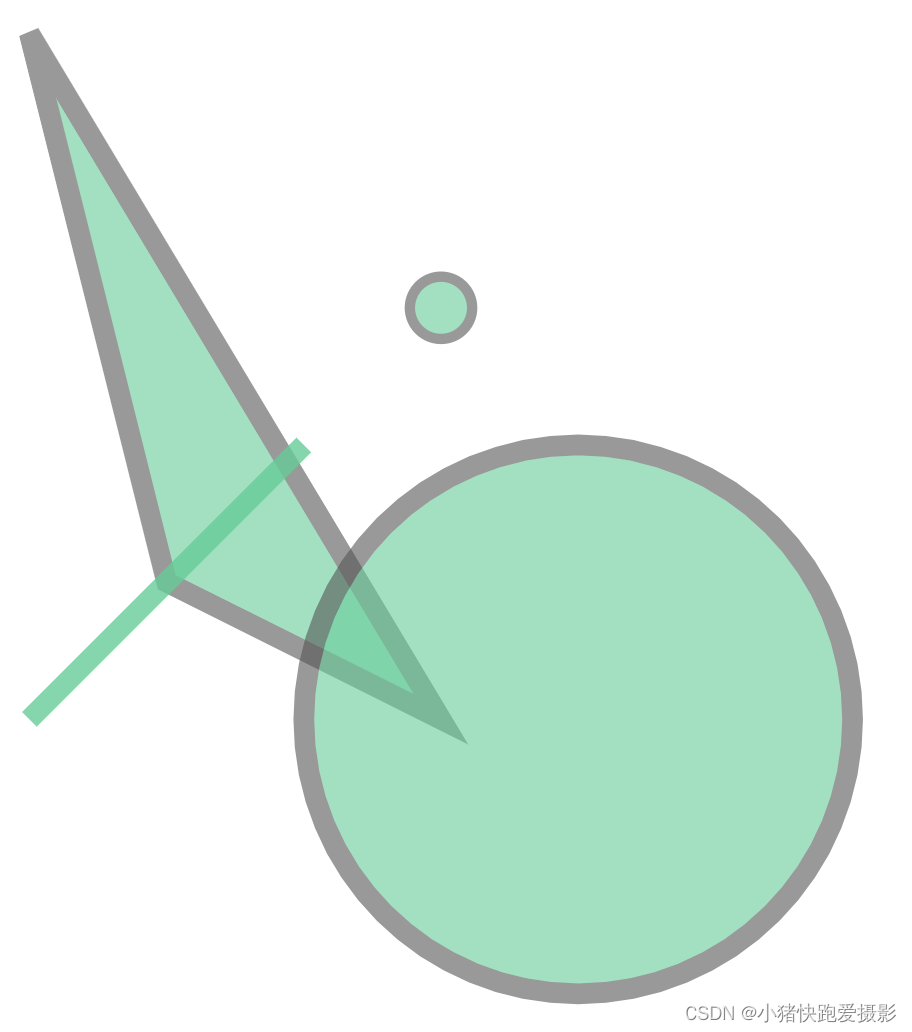
先来看下如何创建点、线、面:
from shapely import Point, Polygon, GeometryCollection,LineStringpoint = Point(3, 3)
polygon = Polygon([(0, 5), (1, 1), (3, 0)])
circ = Point(4, 0).buffer(2)
line = LineString([(0, 0), (2, 2)])
polygon.intersection(circ)GeometryCollection([point, polygon, circ,line])
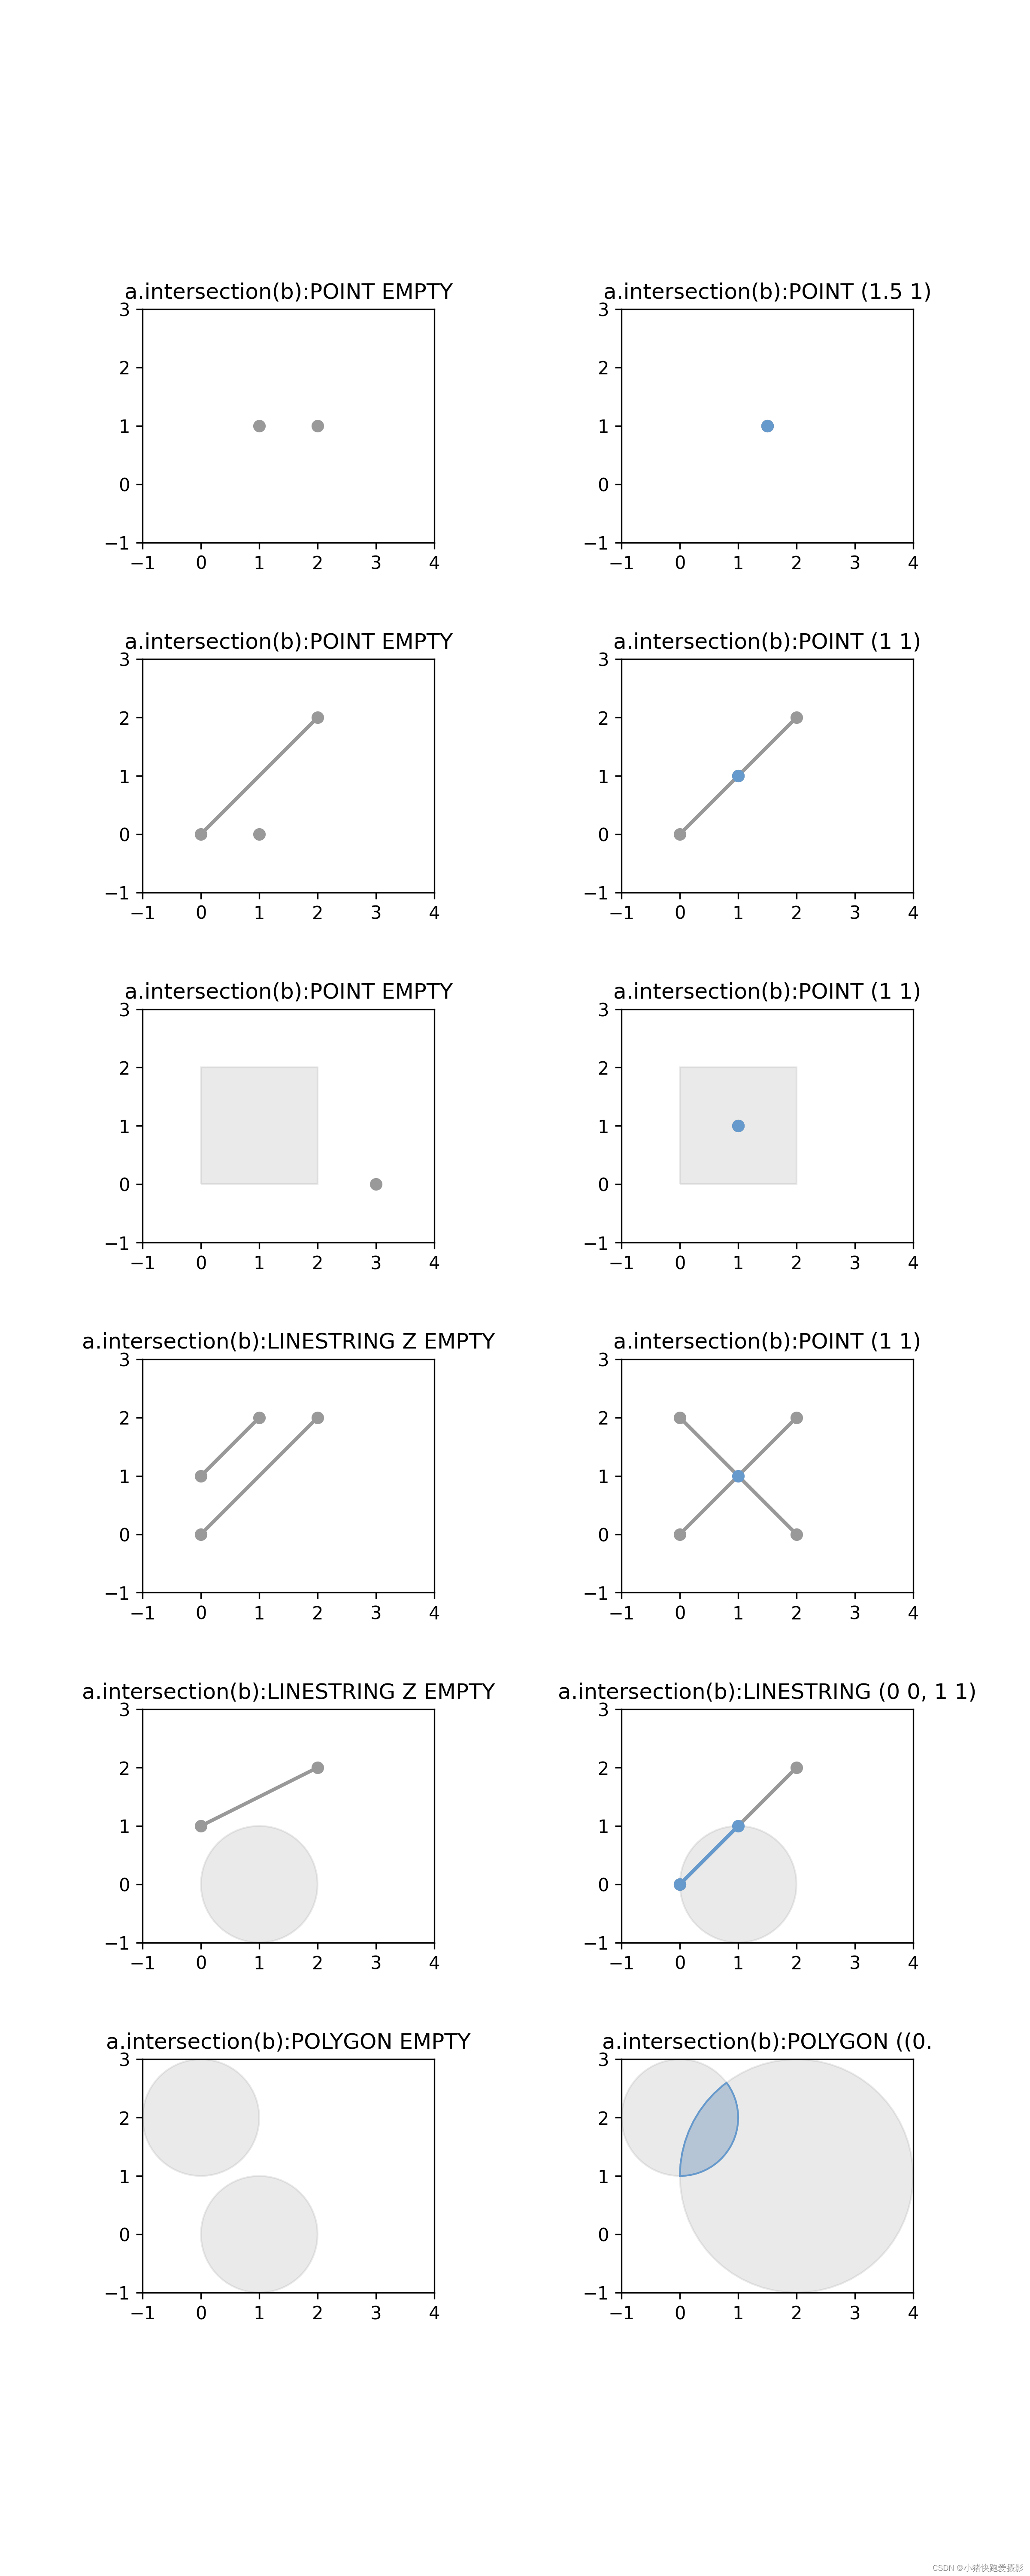
点面关系展示图
点面关系代码
# figures.py
from math import sqrt
from shapely import affinityGM = (sqrt(5)-1.0)/2.0
W = 8.0
H = W*GM
SIZE = (W, H)BLUE = '#6699cc'
GRAY = '#999999'
DARKGRAY = '#333333'
YELLOW = '#ffcc33'
GREEN = '#339933'
RED = '#ff3333'
BLACK = '#000000'def add_origin(ax, geom, origin):x, y = xy = affinity.interpret_origin(geom, origin, 2)ax.plot(x, y, 'o', color=GRAY, zorder=1)ax.annotate(str(xy), xy=xy, ha='center',textcoords='offset points', xytext=(0, 8))def set_limits(ax, x0, xN, y0, yN):ax.set_xlim(x0, xN)ax.set_xticks(range(x0, xN+1))ax.set_ylim(y0, yN)ax.set_yticks(range(y0, yN+1))ax.set_aspect("equal")
# main.py
import matplotlib.pyplot as plt
from shapely.geometry import Point, LineString, Polygon
from shapely.plotting import plot_polygon, plot_points, plot_line
from figures import BLUE, GRAY, set_limitsfig = plt.figure(1, figsize=(8, 20), dpi=300)
fig.subplots_adjust(wspace=0.5, hspace=0.5)  # 调整边距和子图的间距# 1.1 判断点和点是否重叠
ax = fig.add_subplot(621)
a = Point(1, 1)
b = Point(2, 1)
plot_points(a, ax=ax, color=GRAY)
plot_points(b, ax=ax, color=GRAY)
plot_points(a.intersection(b), ax=ax, color=BLUE)
ax.set_title(f'a.intersection(b):{a.intersection(b)}')
set_limits(ax, -1, 4, -1, 3)# 1.2 判断点和点是否重叠
ax = fig.add_subplot(622)
a = Point(1.5, 1)
b = Point(1.5, 1)
plot_points(a, ax=ax, color=GRAY)
plot_points(b, ax=ax, color=GRAY)
plot_points(a.intersection(b), ax=ax, color=BLUE)
ax.set_title(f'a.intersection(b):{a.intersection(b)}')
set_limits(ax, -1, 4, -1, 3)# 2.1 判断点和线是否重叠
ax = fig.add_subplot(623)
a = Point(1, 0)
b = LineString([(0, 0), (2, 2)])
plot_points(a, ax=ax, color=GRAY)
plot_line(b, ax=ax, color=GRAY)
plot_points(a.intersection(b), ax=ax, color=BLUE)
ax.set_title(f'a.intersection(b):{a.intersection(b)}')
set_limits(ax, -1, 4, -1, 3)# 2.2 判断点和点是否重叠
ax = fig.add_subplot(624)
a = Point(1, 1)
b = LineString([(0, 0), (2, 2)])
plot_points(a, ax=ax, color=GRAY)
plot_line(b, ax=ax, color=GRAY)
plot_points(a.intersection(b), ax=ax, color=BLUE)
ax.set_title(f'a.intersection(b):{a.intersection(b)}')
set_limits(ax, -1, 4, -1, 3)# 3.1 判断点和面是否重叠
ax = fig.add_subplot(625)
a = Point(3, 0)
b = Polygon([(0, 0), (0, 2), (2, 2), (2, 0)])
plot_points(a, ax=ax, color=GRAY)
plot_polygon(b, ax=ax, add_points=False, color=GRAY, alpha=0.2)
plot_points(a.intersection(b), ax=ax, color=BLUE)
ax.set_title(f'a.intersection(b):{a.intersection(b)}')
set_limits(ax, -1, 4, -1, 3)# 3.2 判断点和面是否重叠
ax = fig.add_subplot(626)
a = Point(1, 1)
b = Polygon([(0, 0), (0, 2), (2, 2), (2, 0)])
plot_points(a, ax=ax, color=GRAY)
plot_polygon(b, ax=ax, add_points=False, color=GRAY, alpha=0.2)
plot_points(a.intersection(b), ax=ax, color=BLUE)
ax.set_title(f'a.intersection(b):{a.intersection(b)}')
set_limits(ax, -1, 4, -1, 3)# 4.1 判断线和线是否重叠
ax = fig.add_subplot(627)
a = LineString([(0, 0), (2, 2)])
b = LineString([(0, 1), (1, 2)])
plot_line(a, ax=ax, color=GRAY)
plot_line(b, ax=ax, color=GRAY)
plot_points(a.intersection(b), ax=ax, color=BLUE)
ax.set_title(f'a.intersection(b):{a.intersection(b)}')
set_limits(ax, -1, 4, -1, 3)# 4.2 判断线和线是否重叠
ax = fig.add_subplot(628)
a = LineString([(0, 0), (2, 2)])
b = LineString([(2, 0), (0, 2)])
plot_line(a, ax=ax, color=GRAY)
plot_line(b, ax=ax, color=GRAY)
plot_points(a.intersection(b), ax=ax, color=BLUE)
ax.set_title(f'a.intersection(b):{a.intersection(b)}')
set_limits(ax, -1, 4, -1, 3)# 5.1 判断线和面是否重叠
ax = fig.add_subplot(629)
a = LineString([(0, 1), (2, 2)])
b = Point(1, 0).buffer(1)
plot_line(a, ax=ax, color=GRAY)
plot_polygon(b, ax=ax, add_points=False, color=GRAY, alpha=0.2)
plot_points(a.intersection(b), ax=ax, color=BLUE)
ax.set_title(f'a.intersection(b):{a.intersection(b)}')
set_limits(ax, -1, 4, -1, 3)# 5.2 判断线和面是否重叠
ax = fig.add_subplot(6, 2, 10)
a = LineString([(0, 0), (2, 2)])
b = Point(1, 0).buffer(1)
plot_line(a, ax=ax, color=GRAY)
plot_polygon(b, ax=ax, add_points=False, color=GRAY, alpha=0.2)
plot_line(a.intersection(b), ax=ax, color=BLUE)
ax.set_title(f'a.intersection(b):{a.intersection(b)}')
set_limits(ax, -1, 4, -1, 3)# 6.1 判断面和面是否重叠
ax = fig.add_subplot(6, 2, 11)
a = Point(0, 2).buffer(1)
b = Point(1, 0).buffer(1)
plot_polygon(a, ax=ax, add_points=False, color=GRAY, alpha=0.2)
plot_polygon(b, ax=ax, add_points=False, color=GRAY, alpha=0.2)
plot_points(a.intersection(b), ax=ax, color=BLUE)
ax.set_title(f'a.intersection(b):{a.intersection(b)}')
set_limits(ax, -1, 4, -1, 3)# 6.2 判断面和面是否重叠
ax = fig.add_subplot(6, 2, 12)
a = Point(0, 2).buffer(1)
b = Point(2, 1).buffer(2)
plot_polygon(a, ax=ax, add_points=False, color=GRAY, alpha=0.2)
plot_polygon(b, ax=ax, add_points=False, color=GRAY, alpha=0.2)
plot_polygon(a.intersection(b), ax=ax, add_points=False, color=BLUE)
ax.set_title(f'a.intersection(b):{a.intersection(b)}'[:30])
set_limits(ax, -1, 4, -1, 3)plt.savefig('output.png')
plt.show()
这篇关于【附代码】使用Shapely计算点面关系的文章就介绍到这儿,希望我们推荐的文章对编程师们有所帮助!


