本文主要是介绍Python计算机视觉编程——第六章 图像聚类,希望对大家解决编程问题提供一定的参考价值,需要的开发者们随着小编来一起学习吧!
目录
- 1 K-means聚类
- 1.1 Scipy聚类包
- 1.2 图像聚类
- 1.3 在主成分上可视化图像
- 1.4 像素聚类
- 2 层次聚类
- 3 谱聚类
聚类可以用于识别,划分图像数据集,组织与导航。
1 K-means聚类
K-means是一种将输入数据划分为k个簇的简单的聚类算法。步骤如下:
(1) 以随机或猜测的方式初始化类中心 u i , i = 1 ⋯ k ; u_i,i=1\cdots k; ui,i=1⋯k;
(2)将每个数据点归并到离它距离最近的类中心所属的类 c i c_i ci,
(3)对所有属于该类的数据点求平均,将平均值作为新的类中心,
(4)重复步骤(2)和步骤(3)直到收敛。
K-means 试图使类内总方差最小:
V = ∑ i = 1 k ∑ x j ∈ c i ( x j − μ i ) 2 V=\sum_{i=1}^{k}\sum_{x_{j}\in c_{i}}(x_{j}-\mu_{i})^{2} V=i=1∑kxj∈ci∑(xj−μi)2
最大缺陷是必须预先设定聚类数k,如果选择不恰当则会导致聚类出来的结果很差。优点是容易实现,可以并行计算。
1.1 Scipy聚类包
Scipy矢量量化包scipy.cluster.vp中由K-means的实现。
from scipy.cluster.vq import *
from numpy import *
from pylab import *class1 = 1.5 * randn(100,2)
class2 = randn(100,2) + array([5,5])
features = vstack((class1,class2))centroids,variance = kmeans(features,2)
code,distance = vq(features,centroids)figure()
ndx = where(code==0)[0]
plot(features[ndx,0],features[ndx,1],'*')
ndx = where(code==1)[0]
plot(features[ndx,0],features[ndx,1],'r.')
plot(centroids[:,0],centroids[:,1],'go')
axis('off')
show()
处理结果如下:预测出来的类分别标记为蓝色星号和红色点。

1.2 图像聚类
使用pickle模块载入模型文件,在主成分上对图像进行投影,使用下面的方法聚类:
设定聚类数k=4,使用scipy的whiten()函数对数据白化处理,进行归一化,使用每个特征具有单位方差。使用如下代码可视化聚类后的结果
1.3 在主成分上可视化图像
可以在一对主成分方向的坐标上可视化这些图像。一种方法是将图像投影到两个主成分上,改变投影。
import imtools, pca
from PIL import Image, ImageDraw
from pylab import *
import  hclusterimlist = imtools.get_imlist('C:/Users/23232/Desktop/data/selectedfontimages/a_selected_thumbs')
imnbr = len(imlist)immatrix = array([array(Image.open(im)).flatten() for im in imlist], 'f')
V, S, immean = pca.pca(immatrix)projected = array([dot(V[[0, 1]], immatrix[i] - immean) for i in range(imnbr)])h, w = 1200, 1200img = Image.new('RGB', (w, h), (255, 255, 255))
draw = ImageDraw.Draw(img)draw.line((0, h/2, w, h/2), fill=(255, 0, 0))
draw.line((w/2, 0, w/2, h), fill=(255, 0, 0))scale = abs(projected).max(0)
scaled = floor(array([(p/scale) * (w/2 - 20, h/2 - 20) + (w/2, h/2)for p in projected])).astype(int)for i in range(imnbr):nodeim = Image.open(imlist[i])nodeim.thumbnail((25, 25))ns = nodeim.sizebox = (scaled[i][0] - ns[0] // 2, scaled[i][1] - ns[1] // 2,scaled[i][0] + ns[0] // 2 + 1, scaled[i][1] + ns[1] // 2 + 1)img.paste(nodeim, box)
figure()
imshow(img)
axis('off')
img.save('pca_font.png')
show()

二维投影后相似的字体图像距离较近
1.4 像素聚类
将图像区域或像素合并成有意义的部分称为图像分割。
from PIL import Image
from matplotlib import pyplot as plt
import numpy as np
from scipy.cluster.vq import *
steps = 50
im = np.array(Image.open('jimei.jpg'))
dx = im.shape[0] / steps
dy = im.shape[1] / steps
features = []
for x in range(steps):for y in range(steps):R = np.mean(im[int(x) * int(dx):(int(x) + 1) * int(dx), int(y) * int(dy):(int(y) + 1) * int(dy), 0])G = np.mean(im[int(x) * int(dx):(int(x) + 1) * int(dx), int(y) * int(dy):(int(y) + 1) * int(dy), 1])B = np.mean(im[int(x) * int(dx):(int(x) + 1) * int(dx), int(y) * int(dy):(int(y) + 1) * int(dy), 2])features.append([R, G, B])
features = np.array(features, 'f')
centroids, variance = kmeans(features, 3)
code, distance = vq(features, centroids)
codeim = code.reshape(steps, steps)
codeim = np.array(Image.fromarray(codeim).resize(im.shape[:2]))
plt.figure()
plt.subplot(121)
plt.imshow(im)
plt.axis('off')
plt.subplot(122)
plt.imshow(codeim)
plt.axis('off')
plt.show()

2 层次聚类
层次聚类是另一种简单但有效的聚类算法,思想上基于样本间成对距离建立一个简相似性树。该算法首先将特征问量距离最近的两个样本归并为一组,并在树中创建一个“平均”节点,将这两个距离最近的样本作为该“平均” 节点下的子节点,然后在剩下的包含任意平均节点的样本中寻找下一个最近的对, 重复进行前面的操作。在每一个节点处保存了两个子节点之间的距离。遍历整个树, 通过设定的阈值,遍历过程可以在比阈值大的节点位置终止,从而提取出聚类簇。
优点:1.利用树结构可以可视化数据间的关系,并显示这些簇是如何关联的。
2.对于给定的不同的阈值,可以直接利用原来的树,而不需要重新计算。
缺点:对于实际需要的聚类簇,需要选择一个合适的阈值。
首先将下面代码添加到hcluster.py文件中:
from itertools import combinations
import numpy as np
class ClusterNode(object):def __init__(self, vec, left, right, distance=0.0, count=1):self.left = leftself.right = rightself.vec = vecself.distance = distanceself.count = count  def extract_clusters(self, dist):if self.distance < dist:return [self]return self.left.extract_clusters(dist) + self.right.extract_clusters(dist)def get_cluster_elements(self):return self.left.get_cluster_elements() + self.right.get_cluster_elements()def get_height(self):return self.left.get_height() + self.right.get_height()def get_depth(self):return max(self.left.get_depth(), self.right.get_depth()) + self.distanceclass ClusterLeafNode(object):def __init__(self, vec, id):self.vec = vecself.id = iddef extract_clusters(self, dist):return [self]def get_cluster_elements(self):return [self.id]def get_height(self):return 1def get_depth(self):return 0def L2dist(v1, v2):return np.sqrt(sum((v1 - v2) ** 2))def L1dist(v1, v2):return sum(abs(v1 - v2))def hcluster(features, distfcn=L2dist):distances = {}node = [ClusterLeafNode(np.array(f), id=i) for i, f in enumerate(features)]while len(node) > 1:closest = float('Inf')for ni, nj in combinations(node, 2):if (ni, nj) not in distances:distances[ni, nj] = distfcn(ni.vec, nj.vec)d = distances[ni, nj]if d < closest:closest = dlowestpair = (ni, nj)ni, nj = lowestpairnew_vec = (ni.vec + nj.vec) / 2.0new_node = ClusterNode(new_vec, left=ni, right=nj, distance=closest)node.remove(ni)node.remove(nj)node.append(new_node)return node[0]
创建一些二维坐标点,对这些数据点进行聚类,设定阈值为5,从列表中提取这些聚类簇,打印出来。
from scipy import randn
import hcluster
import numpy as npclass1 = 1.5 * randn(100, 2)
class2 = randn(100, 2) + np.array([5, 5])
features = np.vstack((class1, class2))tree = hcluster.ClusterLeafNode.hcluster(features)
clusters = tree.extract_clusters(5)
print('number of clusters', len(clusters))
for c in clusters:print(c.get_cluster_elements())

图像聚类
使用sunsets中的图像数据,运行如下代码:
import hcluster
from matplotlib.pyplot import *
from numpy import *
from PIL import Imagepath = 'C:/Users/23232/Desktop/PCV.geometry/flickr-sunsets-small'
imlist = [os.path.join(path, f) for f in os.listdir(path) if f.endswith('.jpg')]
features = zeros([len(imlist), 512])
for i, f in enumerate(imlist):im = array(Image.open(f))h, edges = histogramdd(im.reshape(-1, 3), 8,  range=[(0, 255), (0, 255), (0, 255)])features[i] = h.flatten()
tree = hcluster.hcluster(features)clusters = tree.extract_clusters(0.23 * tree.distance)
for c in clusters:elements = c.get_cluster_elements()nbr_elements = len(elements)if nbr_elements > 3:figure()for p in range(minimum(nbr_elements, 20)):subplot(4, 5, p + 1)im = array(Image.open(imlist[elements[p]]))imshow(im)axis('off')
show()hcluster.draw_dendrogram(tree, imlist, filename='sunset.pdf')
最终结果如下:


3 谱聚类
对于 n n n个元素 (如 n n n幅图像),相似矩阵 (或亲和矩阵,有时也称距离矩阵)是一个 n × n n\times n n×n的矩阵,矩阵每个元素表示两两之间的相似性分数。谱聚类是由相似性矩阵构建谱矩阵而得名的。对该谱矩阵进行特征分解得到的特征向量可以用于降维,然后聚类。
优点:仅需输入相似性矩阵,并且可以采用你所想到的任意度量方式构建该相似性矩阵。
谱聚类过程如下:给定一个 n × n n\times n n×n的相似矩阵 S , s i j S,s_ij S,sij为相似性分数,我们可以
创建一个矩阵,称为拉普拉斯矩阵 1 : ^{1}: 1:
L = I − D − 1 / 2 S D − 1 / 2 L=I-D^{-1/2}SD^{-1/2} L=I−D−1/2SD−1/2
其中, I I I是单位矩阵, D D D 是对角矩阵,对角线上的元素是 S S S对应行元素之和,
D = d i a g ( d i ) D= diag( d_{i}) D=diag(di), d i = ∑ j s i j d_{i}= \sum _{j}s_{ij} di=∑jsij。拉普拉斯矩阵中的 D − 1 / 2 D^{-1/2} D−1/2为:
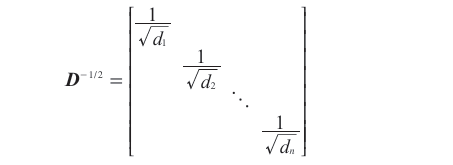
为了使表述更简洁,对于相似性矩阵中的元素 s i j s_{ij} sij,我们使用较小的值并且要求
s i j ⩾ 0 s_{ij}\geqslant0 sij⩾0 (在这种情况下,距离矩阵可能更合适)。
代码如下:
import imtools, pca
from PIL import Image, ImageDraw
from pylab import *
from scipy.cluster.vq import *imlist = imtools.get_imlist('C:/Users/23232/Desktop/data/selectedfontimages/a_selected_thumbs')
imnbr = len(imlist)immatrix = array([array(Image.open(im)).flatten() for im in imlist], 'f')
V, S, immean = pca.pca(immatrix)projected = array([dot(V[[0, 1]], immatrix[i] - immean) for i in range(imnbr)])n = len(projected)
S = array([[sqrt(sum((projected[i] - projected[j]) ** 2))for i in range(n)] for j in range(n)], 'f')
rowsum = sum(S, axis=0)
D = diag(1 / sqrt(rowsum))
I = identity(n)
L = I - dot(D, dot(S, D))
U, sigma, V = linalg.svd(L)
k = 5
features = array(V[:k]).T
features = whiten(features)
centroids, distortion = kmeans(features, k)
code, distance = vq(features, centroids)
for c in range(k):ind = where(code == c)[0]figure()gray()for i in range(minimum(len(ind), 39)):im = Image.open(imlist[ind[i]])subplot(4, 10, i + 1)imshow(array(im))axis('equal')axis('off')
show()
下图为使用拉普拉斯矩阵的特征向量对字体图像进行谱聚类。

这篇关于Python计算机视觉编程——第六章 图像聚类的文章就介绍到这儿,希望我们推荐的文章对编程师们有所帮助!


