本文主要是介绍kube-promethesu调整coredns监控,希望对大家解决编程问题提供一定的参考价值,需要的开发者们随着小编来一起学习吧!
K8s集群版本是二进制部署的1.20.4,kube-prometheus对应选择的版本是kube-prometheus-0.8.0
Coredns是在安装集群的时候部署的,采用的也是该版本的官方文档,kube-prometheus中也有coredns的监控配置信息,但是在prometheus的监控页面并没有发现coredns的servicemonitor.。所以我们需要一步步的去排查该问题。
先看下coredns的servicemonitor
vim kubernetes-serviceMonitorCoreDNS.yaml
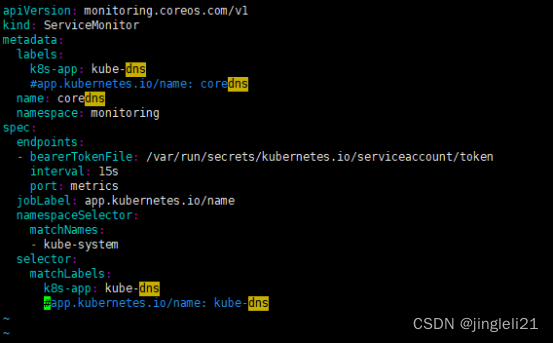
apiVersion: monitoring.coreos.com/v1
kind: ServiceMonitor
metadata:labels:app.kubernetes.io/name: corednsname: corednsnamespace: monitoring
spec:endpoints:- bearerTokenFile: /var/run/secrets/kubernetes.io/serviceaccount/tokeninterval: 15sport: metricsjobLabel: app.kubernetes.io/namenamespaceSelector:matchNames:- kube-systemselector:matchLabels:app.kubernetes.io/name: kube-dns
再来看下coredns的service配置
---
apiVersion: v1
kind: Service
metadata:name: kube-dnsnamespace: kube-systemannotations:prometheus.io/port: "9153"prometheus.io/scrape: "true"labels:k8s-app: kube-dnskubernetes.io/cluster-service: "true"addonmanager.kubernetes.io/mode: Reconcilekubernetes.io/name: "CoreDNS"
spec:selector:k8s-app: kube-dnsclusterIP: 10.0.0.2ports:- name: dnsport: 53protocol: UDP- name: dns-tcpport: 53protocol: TCP- name: metricsport: 9153protocol: TCP
从上面两段可以看到,servicemonitor去匹配的service是
labels:
app.kubernetes.io/name: coredns
而我们创建的coredns的service的labels
labels:
k8s-app: kube-dns
kubernetes.io/cluster-service: "true"
addonmanager.kubernetes.io/mode: Reconcile
kubernetes.io/name: "CoreDNS"
两边没有对应上,所以该servicemonitor无法匹配到对应的service,所以监控不到我们的coredns.
因coredns对服务的影响比较大,我们选择去修改servicemonitor
修改labels后重新apply
Kubectl apply -f kubernetes-serviceMonitorCoreDNS.yaml
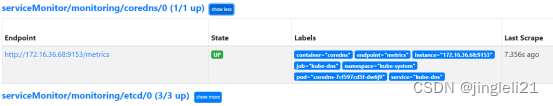
coredns就加载出来了
配置coredns的监控信息
apiVersion: monitoring.coreos.com/v1
kind: PrometheusRule
metadata:labels:app.kubernetes.io/name: kube-prometheusapp.kubernetes.io/part-of: kube-prometheusprometheus: k8srole: alert-rulesname: kubernetes-monitoring-coredns-rulesnamespace: monitoringspec:groups:- name: corednsrules:- alert: CoreDNSDownannotations:message: CoreDNS has disappeared from Prometheus target discovery.runbook_url: https://github.com/povilasv/coredns-mixin/tree/master/runbook.md#alert-name-corednsdownexpr: |absent(up{job="kube-dns"} == 1)for: 15mlabels:severity: critical- alert: CoreDNS的dns请求持续时间延迟高annotations:message: CoreDNS has 99th percentile latency of {{ $value }} seconds for server{{ $labels.server }} zone {{ $labels.zone }} .runbook_url: https://github.com/povilasv/coredns-mixin/tree/master/runbook.md#alert-name-corednslatencyhighexpr: |histogram_quantile(0.99, sum(rate(coredns_dns_request_duration_seconds_bucket{job="kube-dns"}[5m])) by(server, zone, le)) > 4for: 10mlabels:severity: critical- alert: CoreDNS响应错误高annotations:message: CoreDNS is returning SERVFAIL for {{ $value | humanizePercentage }} of   requests.runbook_url: https://github.com/povilasv/coredns-mixin/tree/master/runbook.md#alert-name-corednserorshighexpr: |sum(rate(coredns_dns_responses_total{job="kube-dns",rcode="SERVFAIL"}[5m]))/sum(rate(coredns_dns_responses_total{job="kube-dns"}[5m])) > 0.03for: 10mlabels:severity: critical- alert: CoreDNS响应错误高annotations:message: CoreDNS is returning SERVFAIL for {{ $value | humanizePercentage }} of   requests.runbook_url: https://github.com/povilasv/coredns-mixin/tree/master/runbook.md#alert-name-corednserorshighexpr: |sum(rate(coredns_dns_responses_total{job="kube-dns",rcode="SERVFAIL"}[5m]))/sum(rate(coredns_dns_responses_total{job="kube-dns"}[5m])) > 0.01for: 10mlabels:severity: warning- alert: CoreDNS转发请求持续时间延迟高annotations:message: CoreDNS has 99th percentile latency of {{ $value }} seconds forwarding requests to {{ $labels.to }}.runbook_url: https://github.com/povilasv/coredns-mixin/tree/master/runbook.md#alert-name-corednsforwardlatencyhighexpr: |histogram_quantile(0.99, sum(rate(coredns_forward_request_duration_seconds_bucket{job="kube-dns"}[5m])) by(to, le)) > 4for: 10mlabels:severity: critical- alert: CoreDNSForwardErrorsHighannotations:message: CoreDNS is returning SERVFAIL for {{ $value | humanizePercentage }} of forward requests to {{ $labels.to }}.runbook_url: https://github.com/povilasv/coredns-mixin/tree/master/runbook.md#alert-name-corednsforwarderrorshighexpr: |sum(rate(coredns_forward_responses_total{job="kube-dns",rcode="SERVFAIL"}[5m]))/sum(rate(coredns_forward_responses_total{job="kube-dns"}[5m])) > 0.03for: 10mlabels:severity: critical- alert: CoreDNSForwardErrorsHighannotations:message: CoreDNS is returning SERVFAIL for {{ $value | humanizePercentage }} of forward requests to {{ $labels.to }}.runbook_url: https://github.com/povilasv/coredns-mixin/tree/master/runbook.md#alert-name-corednsforwarderrorshighexpr: |sum(rate(coredns_forward_responses_total{job="kube-dns",rcode="SERVFAIL"}[5m]))/sum(rate(coredns_forward_responses_total{job="kube-dns"}[5m])) > 0.01for: 10mlabels:severity: warning- alert: CoreDNSForwardHealthcheckFailureCountannotations:message: CoreDNS health checks have failed to upstream server {{ $labels.to }}.runbook_url: https://github.com/povilasv/coredns-mixin/tree/master/runbook.md#alert-name-corednsforwardhealthcheckfailurecountexpr: |sum(rate(coredns_forward_healthcheck_failures_total{job="kube-dns"}[5m])) by (to) > 0for: 10mlabels:severity: warning- alert: CoreDNSForwardHealthcheckBrokenCountannotations:message: CoreDNS health checks have failed for all upstream servers.runbook_url: https://github.com/povilasv/coredns-mixin/tree/master/runbook.md#alert-name-corednsforwardhealthcheckbrokencountexpr: |sum(rate(coredns_forward_healthcheck_broken_total{job="kube-dns"}[5m])) > 0for: 10mlabels:severity: warning- alert: CorednsPanicCountexpr: increase(coredns_panics_total[1m]) > 0for: 0mlabels:severity: criticalannotations:summary: CoreDNS Panic Count (instance {{ $labels.instance }})description: "Number of CoreDNS panics encountered\n  VALUE = {{ $value }}\n  LABELS = {{ $labels }}"
这篇关于kube-promethesu调整coredns监控的文章就介绍到这儿,希望我们推荐的文章对编程师们有所帮助!


