本文主要是介绍探索多模态MR图像的脑肿瘤分割任务结构| 文献速递-深度学习肿瘤自动分割,希望对大家解决编程问题提供一定的参考价值,需要的开发者们随着小编来一起学习吧!
Title
题目
Exploring Task Structure for Brain Tumor Segmentation From Multi Modality MR Images
探索多模态MR图像的脑肿瘤分割任务结构
01
文献速递介绍
脑肿瘤分割旨在从多模态磁共振(MR)序列中自动分割肿瘤区域,这些序列由先进的医学成像设备拍摄。通过分割脑肿瘤,可以提供肿瘤体积、形状和定位(包括整个肿瘤区域、增强肿瘤核心区域和肿瘤核心区域),这在脑肿瘤诊断和监测中起着至关重要的作用。然而,从噪声医学图像中分割脑肿瘤绝非易事,许多研究努力已投入到这一领域,通常遵循两条主要路径。一方面,现有方法将多模态脑肿瘤分割任务视为常见的语义分割问题,并基于语义分割的网络架构构建模型。另一方面,一些现有方法将通常用于语义分割的二维卷积神经网络(CNN)架构扩展到三维CNN架构,以适应所研究的多模态MR体数据结构。
然而,现有脑肿瘤分割方法试图复制RGB图像的语义分割方法,似乎过于依赖CNN架构,而忽略了临床实践中识别脑肿瘤区域的基本规则。因此,这些方法的性能仍然不尽人意。实际上,脑病医生通常通过权衡不同模态的体积数据来发现不同的肿瘤区域,因为他们知道不同的模态数据可能反映不同的病理特征。这揭示了脑肿瘤分割中的任务-模态结构,并表明了每种模态数据与感兴趣的肿瘤区域之间的关系。
另一方面,脑病医生在寻找三个肿瘤区域时,既不是同时进行,也不是平等对待每种模态来寻找特定肿瘤区域。据我们所知,这是因为医生心中有任务结构的优先级:一方面,他们知道这三个肿瘤区域是相互包含的,而不是独立存在的。因此,他们通过首先定位最明显的肿瘤区域,然后搜索其他区域来发现这些肿瘤区域
Abstract
摘要
Brain tumor segmentation, which aims at segment ing the whole tumor area, enhancing tumor core area, and tumorcore area from each input multi-modality bio-imaging data, has**received considerable attention from both academia and industry.However, the existing approaches usually treat this problem as acommon semantic segmentation task without taking into accountthe underlying rules in clinical practice. In reality, physicianstend to discover different tumor areas by weighing differentmodality volume data. Also, they initially segment the mostdistinct tumor area, and then gradually search around to findthe other two. We refer to the first property as the task-modalitystructure while the second property as the task-task structure,based on which we propose a novel task-structured brain tumorsegmentation network (TSBTS net). Specifically, to explore thetask-modality structure, we design a modality-aware featureembedding mechanism to infer the important weights of themodality data during network learning. To explore the task-taskstructure, we formulate the prediction of the different tumorareas as conditional dependency sub-tasks and encode suchdependency in the network stream. Experiments on BraTSbenchmarks show that the proposed method achieves superiorperformance in segmenting the desired brain tumor areas whilerequiring relatively lower computational costs, compared to otherstate-of-the-art methods and baseline models.
脑肿瘤分割旨在划分整个肿瘤区域、增强肿瘤核心区域,以及从每个输入的多模态生物成像数据中提取肿瘤核心区域,这一领域已经获得了学术界和工业界的广泛关注。然而,现有方法通常将此问题视为常规的语义分割任务,没有考虑到临床实践中的潜在规则。实际上,医生倾向于通过权衡不同模态的体积数据来发现不同的肿瘤区域。此外,他们通常先分割最明显的肿瘤区域,然后逐渐搜索周围区域以找到其他两个区域。我们将第一个特性称为任务-模态结构,而第二个特性称为任务-任务结构。基于此,我们提出了一种新颖的结构化脑肿瘤分割网络(TSBTS网络)。具体来说,为了探索任务-模态结构,我们设计了一种模态感知的特征嵌入机制,在网络学习期间推断模态数据的重要权重。为了探索任务-任务结构,我们将不同肿瘤区域的预测表述为条件依赖的子任务,并在网络流中编码此类依赖。在BraTS基准测试上的实验表明,与其他最先进的方法和基线模型相比,所提出的方法在分割所需的脑肿瘤区域方面表现出色,同时计算成本相对较低。
Method
方法
The existing works usually formulate the brain tumorsegmentation as a structured prediction problem, where the“structure” mainly refers to the context structure, i.e., globalor local neighborhood interactions. In this paper, alternatively,we interpret it as a task structured prediction problem basedon the valuable domain knowledge from clinical practice.Given the training data {Xm, Ym}, m ∈ {1, 2,··· , M}, whereXm = {XT 1m , XT 1c m , XT 2m , Xm FLAI R} is the multi-modalityvolume data while Ym* = {Ym ET , Y*m T C, Ym W T } denotes theannotated ground-truth tumor areas, the goal of the proposedTSBTS net is to learn to predict the segmentation masksof the tumor areas ˆ
Ym = { ˆYETm , ˆYT Cm , ˆYW Tm } from eachinput Xm. Considering no task structure, the existing methods, such as would directly predict labelsfor multiple (sub-)tasks simultaneously and use unweightedmodality features as input. In contrast, our proposed TSBTSnet explores the two-fold important task structures, i.e., thetask-task structure and task-modality structure, to implementthe multi-modality brain tumor segmentation task, which formulates the prediction of multiple (sub-)tasks in a conditionaldependency fashion and introduces the modality-aware featureweighting mechanism for each specific (sub-)task.
现有工作通常将脑肿瘤分割定义为一个结构化预测问题,其中“结构”主要指的是上下文结构,即全局或局部邻域交互。然而,在本文中,我们基于来自临床实践的宝贵领域知识,将其解释为一个任务结构化预测问题。
给定训练数据 {Xm, Ym},其中 m ∈ {1, 2, ..., M},Xm = {XT1m, XT1cm, XT2m, Xm FLAIR} 是多模态体积数据,而 Ym = {Ym ET, Ym TC, Ym WT} 表示标注的实际肿瘤区域。所提出的TSBTS网络的目标是学习预测每个输入 Xm 的肿瘤区域的分割掩码 ˆYm = {ˆYETm, ˆYTCm, ˆYWTm}。考虑到没有任务结构,现有方法如会直接同时为多个(子)任务预测标签,并使用未加权的模态特征作为输入。相比之下,我们提出的TSBTS网络探索了两个重要的任务结构,即任务-任务结构和任务-模态结构,来实施多模态脑肿瘤分割任务,这种方式将多个(子)任务的预测制定为条件依赖方式,并为每个特定的(子)任务引入了模态感知特征加权机制。
Figure
图
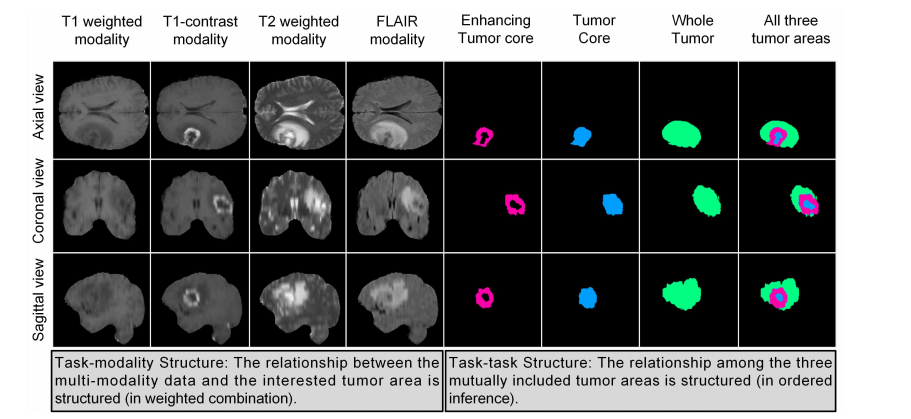
Fig. 1. Illustration of the multi-modality brain tumor segmentation task. On the left, we show MR scans in different modalities and from different views(imagining the entire multi-modality input data is a 3D volume with four modality channels). On the right, we show the ground-truth of the targeted tumorareas. At the bottom of this figure, we reveal two valuable prior knowledge from the clinical practice, which are also the key insights for establishing ourproposed TSBTS net. Notice that, to show examples more clearly, we reduce the black background areas for each slice.
图1. 多模态脑肿瘤分割任务的示意图。在左侧,我们展示了不同模态和不同视角的MR扫描图像(想象整个多模态输入数据是一个具有四个模态通道的3D体积)。在右侧,我们展示了目标肿瘤区域的实际情况。在该图的底部,我们揭示了来自临床实践的两个有价值的先验知识,这些也是我们提出的TSBTS网络的关键见解。请注意,为了更清楚地显示示例,我们减少了每个切片的黑色背景区域。
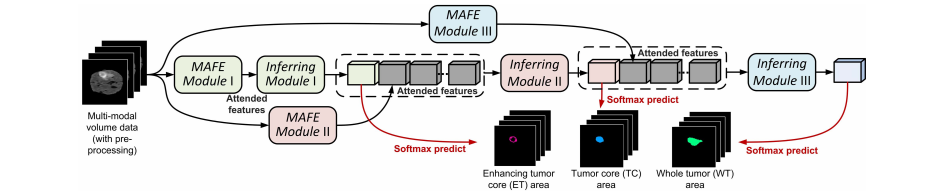
Fig. 2. Illustration of the whole network architecture of the proposed TSBTS net, which contains three modality-aware feature embedding (MAFE) modulesand three inferring modules. The modules in green, red, and blue are used to segment the enhancing tumor core, tumor core, and whole tumor areas,respectively. In the TSBTS net, the task-modality structure is modeled as a weighted combination structure, where the MAFE mechanism is adopted to inferthe importance weights and obtain the weighted features. In addition, the task-task structure is modeled as an ordered inference structure, where the networkmimics the process to discover and segment the three mutually contained areas from the most distinct area to its surrounding areas. Notice that the dashedblocks are not network layers but the input data of each inferring module.
图2. 所提出的TSBTS网络的整体网络架构示意图,该网络包含三个模态感知特征嵌入(MAFE)模块和三个推断模块。用于分割增强肿瘤核心、肿瘤核心和整个肿瘤区域的模块分别以绿色、红色和蓝色表示。在TSBTS网络中,任务-模态结构被建模为加权组合结构,采用MAFE机制来推断重要性权重并获取加权特征。此外,任务-任务结构被建模为有序推理结构,网络模仿从最明显的区域到其周围区域发现和分割三个相互包含区域的过程。请注意,虚线框不是网络层,而是每个推断模块的输入数据。
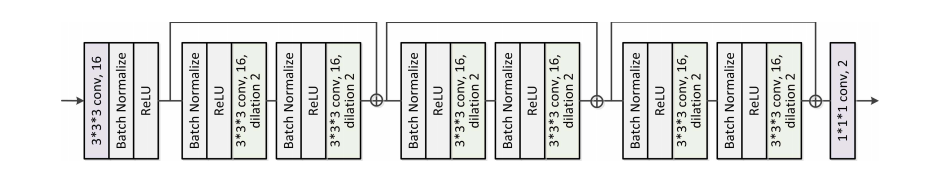
Fig. 3. Illustration of the network architecture of Inferring Module I. The input of the network block is the weighted feature maps obtained from theMAFE Module I, while the output of the network block is the prediction of the ET area. All the convolutional layers perform the 3D voxel-level convolution.The second parameter shown in each convolutional layer is the number of the convolutional kernels. Inspired by , we connect convolution moduleswith post-activation (i.e., Conv-BN-ReLU) and those with pre-activation (i.e., BN-ReLU-Conv) in our network. Notice that the difference between theseinferring modules is that the kernel number and the dilation rate of the dilated convolutional layer in the Inferring Module II are set to 32 and 4, respectively.Accordingly, the kernel number and the dilation rate of the dilated convolutional layer in the Inferring Module III are set to 64 and 8.
图3. 推断模块I的网络架构示意图。该网络块的输入是从MAFE模块I获得的加权特征图,而网络块的输出是ET(增强肿瘤)区域的预测。所有卷积层都执行3D体素级卷积。在每个卷积层中显示的第二个参数是卷积核的数量。受到的启发,我们在网络中连接了带后激活的卷积模块(即,Conv-BN-ReLU)和带前激活的卷积模块(即,BN-ReLU-Conv)。请注意,这些推断模块之间的区别在于,推断模块II中的膨胀卷积层的核数和膨胀率分别设置为32和4。相应地,推断模块III中的膨胀卷积层的核数和膨胀率设置为64和8。

Fig. 4. Illustration of the architecture of the MAFE module. The input of thenetwork block is the original multi-modality volume data, while the output ofthe network block is the weighted feature volume considering the importanceof each modality conditioned on each specific MR slice. Notice that MAFEModule I, II, III share the same architecture. They are placed at differentlocations of the network to explore the importance of each modality data forsegmenting different types of tumor areas.
图4. MAFE模块的架构示意图。网络块的输入是原始的多模态体积数据,而网络块的输出则是考虑到每种模态在每个特定MR切片上的重要性的加权特征体积。请注意,MAFE模块I、II、III具有相同的架构。它们被放置在网络的不同位置,以探索每种模态数据对分割不同类型肿瘤区域的重要性。
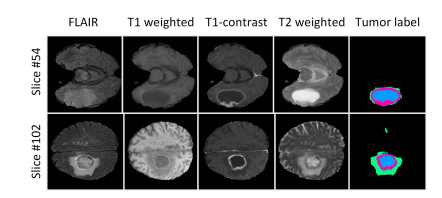
Fig. 5. Examples to explain why we need to learn importance weightsconditioned on the specific MR slice location. The examples in the first roware from Slice #54, from which we can observe that the T2 modality is moreimportant for segmenting the WT area. However, from the examples of Slice#102 (the second row), we observe that the FLAIR modality is more importantfor segmenting the WT area. When segmenting the TC area, the T1 modalityappears to be more important in Slice #54 while less important in Slice #102.
图5. 示例说明为什么我们需要学习基于特定MR切片位置的重要性权重。第一行的示例来自切片#54,从中我们可以观察到T2模态对于分割WT(整个肿瘤)区域更为重要。然而,从切片#102(第二行)的示例中,我们观察到FLAIR模态对于分割WT区域更为重要。在分割TC(肿瘤核心)区域时,T1模态在切片#54中似乎更为重要,而在切片#102中则较为不重要。
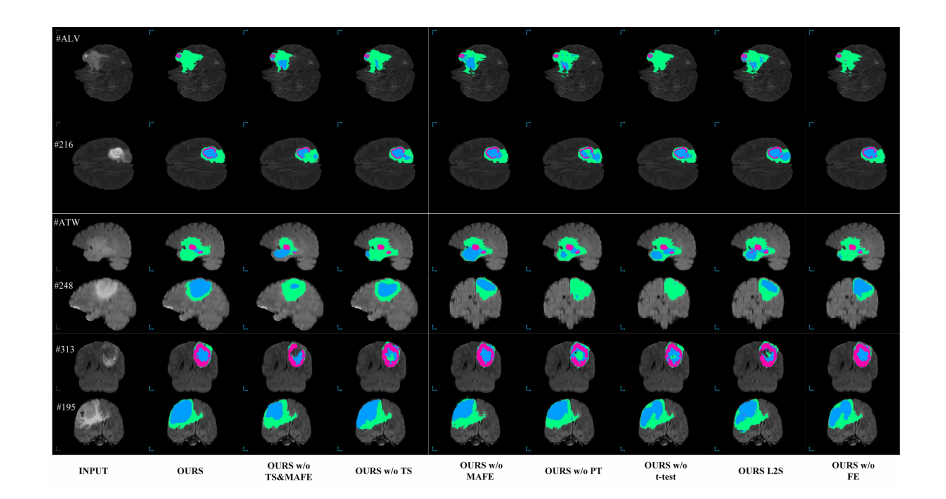
Fig. 6. Examples of the brain tumor segmentation results from the BraTS 2017 Validation Dataset. The green, blue, and pink regions indicate the wholetumor areas, tumor core areas, and enhancing tumor core areas, respectively
图6. 来自BraTS 2017验证数据集的脑肿瘤分割结果示例。绿色、蓝色和粉色区域分别表示整个肿瘤区域、肿瘤核心区域和增强肿瘤核心区域。
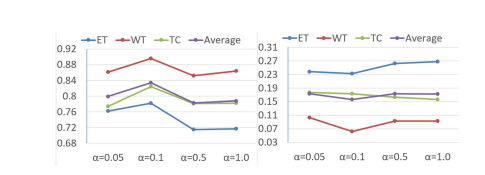
Fig. 7. Influence of the parameter α on the BraTS 2018 dataset. The leftfigure is based on the measurement of the mean Dice score, where highervalues indicate better results. The right figure is based on the measurement ofthe standard deviation of the Dice score, where lower values indicate betterresults.
图7. 参数 α 对BraTS 2018数据集的影响。左图基于平均Dice分数的测量,其中较高的值表示更好的结果。右图基于Dice分数的标准偏差的测量,其中较低的值表示更好的结果。
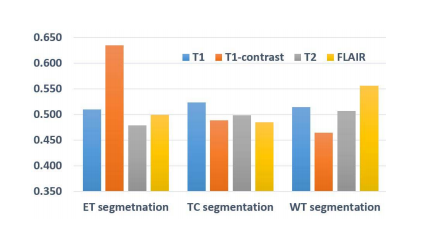
Fig. 8. The average values of the importance weights for each modality datainferred by our TSBTS net when segmenting a certain type of tumor area.
图8. 在分割某一类型的肿瘤区域时,我们的TSBTS网络推断出的每种模态数据的重要性权重的平均值。

Fig. 9. Some examples of the failure cases of our approach. The first rowshows the original input with the FLAIR modality. The green, blue, and pinkregions indicate the WT areas, TC areas, and ET areas, respectively. Thescores reported in the middle of each column are the Dice scores of thepredicted tumor areas. Here scores marked in yellow (i.e., those below 0.8)are considered as the failure cases.
图9. 我们方法的一些失败案例示例。第一行显示了带有FLAIR模态的原始输入。绿色、蓝色和粉红色区域分别表示WT区域、TC区域和ET区域。每列中间报告的分数是预测肿瘤区域的Dice分数。这里用黄色标记的分数(即低于0.8的分数)被视为失败案例。
Table
表

TABLEI comparison of the proposed approach and other state-of-the-art methods on the brats 2017 in terms of the dice score(the higher the better), hausdorff distance (the lower the better), and model parameter (the lower the better).besides the absolute number of model parameters of each compared method, we also report the ratio(under the number of parameters of each model) when comparing the modelparameter of our approach to that of the other method
表 I:在BraTS 2017数据集上,所提出的方法与其他最先进方法的比较,包括Dice分数(数值越高越好)、豪斯多夫距离(数值越低越好)和模型参数(数值越低越好)。除了每种比较方法的模型参数的绝对数量外,我们还报告了在比较我们的方法与其他方法的模型参数时各自模型参数的比例。

TABLE IIcomparison of the proposed approach and other state-of-the-art methods on the brats 2018 in terms of the dice score(the higher the better), hausdorff distance (the lower the better), and model parameter (the lower the better).besides the absolute number of the model parameter of each compared method, we also report the ratio(under the number of parameters of each model) when comparing the model parameters of ourapproach to those of the other methods. notice that as and do not havethe open access projects and results, we implement their algorithmsourselves based on their descriptions for experimental comparison.
表 II:在BraTS 2018数据集上,所提出的方法与其他最先进方法的比较,包括Dice分数(数值越高越好)、豪斯多夫距离(数值越低越好)和模型参数(数值越低越好)。除了每种比较方法的模型参数的绝对数量外,我们还报告了在比较我们方法的模型参数与其他方法的模型参数时的比例。请注意,由于和的项目和结果不是开放获取的,我们根据它们的描述自行实现了它们的算法进行实验比较。
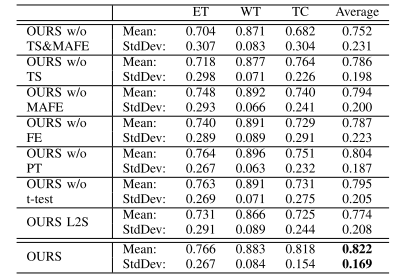
TABLE IIIcomparison of the proposed approach and other baselinemodels in terms of the dice score, where “et”, “wt”,“tc”, and “stddev” are short for “enhancing tumor”,“whole tumor”, “tumor core”, and “standarddeviation”, respectively.
表 III:所提出方法与其他基线模型在Dice分数方面的比较,其中“ET”、“WT”、“TC”和“STDDEV”分别是“增强肿瘤”、“整个肿瘤”、“肿瘤核心”和“标准偏差”的缩写。
这篇关于探索多模态MR图像的脑肿瘤分割任务结构| 文献速递-深度学习肿瘤自动分割的文章就介绍到这儿,希望我们推荐的文章对编程师们有所帮助!


