本文主要是介绍graphviz的基础使用,希望对大家解决编程问题提供一定的参考价值,需要的开发者们随着小编来一起学习吧!
Graphviz官网文档
在线编辑器
d3-graphviz文档
- 字符串使用双引号,可使用 \n 进行换行,b [label = “two \n lines”]
- 有向图digraph,节点关系指向使用 ->
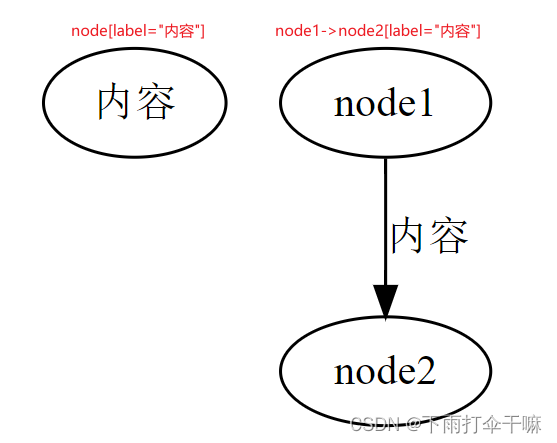
无向图graph,节点关系指向使用 – - node[label = “内容”],'内容’则为该node的显示内容
node1 -> node2[label = “内容”],'内容’则为node1指向node2的边的内容
- rankdir可以设置边的走向,包括:LR,RL,TB,BT
rankdir=LR
- 构造边
一对一:a -> b
一对多:a -> {b, c, d}
多对一:{b, c, d} -> a
多对多:{e, f, g} -> {h, i, j} - node[shape=box],通过shape来设定node的形状
节点形状
shape=polygon,多边形
sides=5,五条边
peripheries=3,三层边框
style=filled,样式为颜色填充
fillcolor=gray,填充颜色为gray
color=lightblue || color = “.7 .3 1.0”,边框颜色为lightblue,若没有设定fillcolor,则填充颜色也为lightblue
skew=.4,节点倾斜角度,正值使多边形顶部向右倾斜,负向左。
distortion=.7,正值会导致顶部大于底部;负值的作用正好相反。
regular = true,可以使你的多边形是一个规则的多边形
orientation = * ,可以让你的多边形旋转*角度


dir设置箭头:forward,back,both,none
A->B [dir=forward]

设置箭头样式:arrowhead=curve
箭头样式

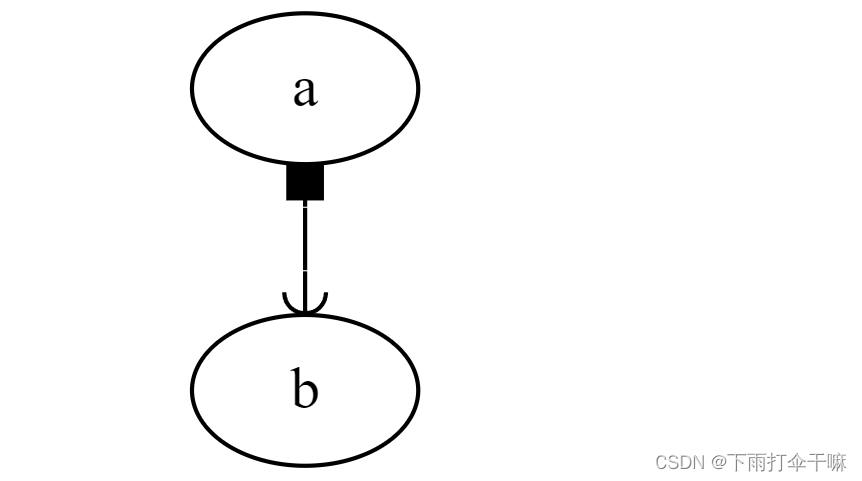
只有当dir为back或both时,arrowtail才生效
digraph b {edge[dir=both]a->b[arrowtail=box, arrowhead=curve]
}
设置箭头箭尾lable
headlabel=“哈哈”, taillabel=“嚯嚯”

- 设置指定的元素在同一层:{rank = same a, d}
rank的选项:same,min,source,max
图最开始的地方为最小,终点处为最大,如果,rankdir=LR,那么{rank=min e, f}则ef位于最左侧,其他同理
rank属性


rank = same处于同层
digraph G{rankdir = LR{node[shape = plaintext]1995 -> 1996 -> 1997 -> 1998 -> 1999 -> 2000 -> 2001}{node[shape = box, style = filled]WAR3 -> Xhero -> Footman -> DOTAWAR3 -> Battleship}{{rank = same 1996 WAR3}{rank = same 1998 Xhero Battleship}{rank = same 1999 Footman}{rank = same 2001 DOTA}}
}

-
设置 边 的label是否有连线:decorate = true

-
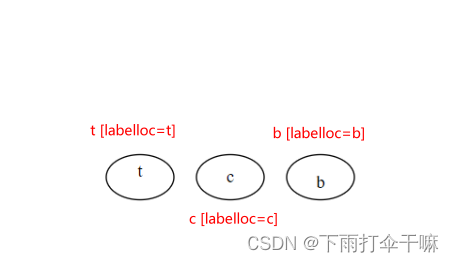
label对齐方式:labelloc = “t”
如果labelloc=t、labelloc=c、labelloc=b,则标签将分别与节点的顶部对齐、居中对齐或与底部对齐。
默认情况下,标签垂直居中。根图标签位于底部,clusters标签位于顶部。
对于graphs 和 clusters,只允许使用labelloc=t和labelloc=b,分别对应于顶部和底部的位置。
labelloc
-
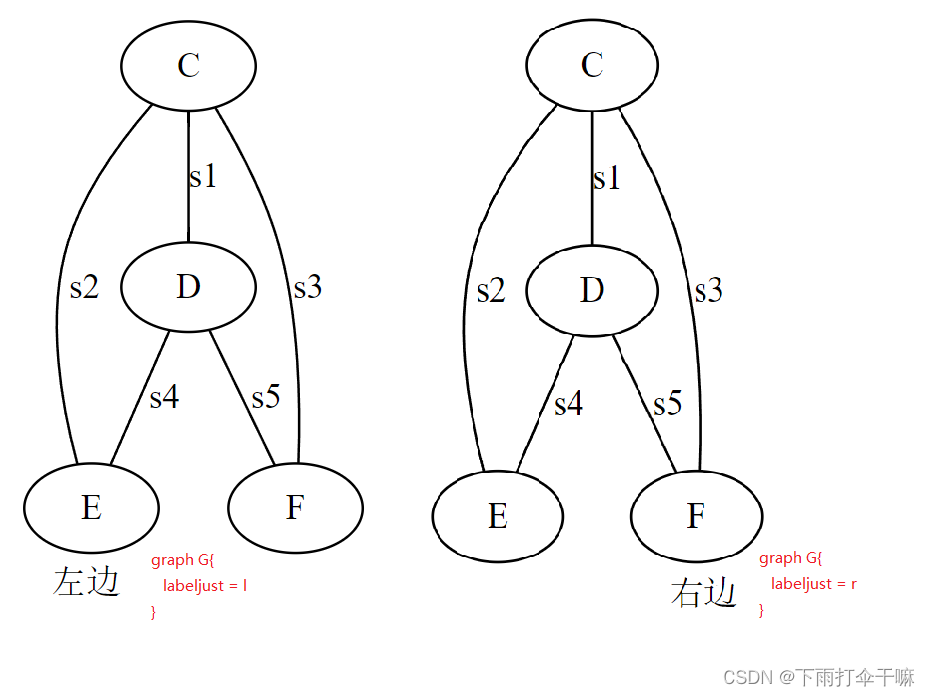
labeljust = l,图标签的位置在左边,也可以设置为r到右边
-
weight: 边的权重,该权重在布局图时会被考虑。较重的边会更短。
A -> B [weight=2] -
record 是由横竖的矩形组成的图形
< f0 >< f1 >< f2 >是port点,可以在节点连接时作为连接点,
比如:struct1:f0 -> struct2:f1,则是从struct1的f0的位置连接到struct2的f1位置
digraph G{node[shape = record]struct1[label = "<f0> left | <f1> middle | <f2> right"]struct2[label = "<f0> one | <f1> two"]struct3[label = "hello \nworld | {b | {c | <here> d | e} | f} | g | h"]struct1 -> struct2struct1 -> struct3
}

digraph G{label = "Binary Search Tree"node[shape = record]A[label = "<f0> | <f1> A | <f2>"]B[label = "<f0> | <f1> B | <f2>"]C[label = "<f0> | <f1> C | <f2>"]D[label = "<f0> | <f1> D | <f2>"]E[label = "<f0> | <f1> E | <f2>"]A: f0: sw -> B: f1A: f2: se -> C: f1B: f0: sw -> D: f1B: f2: se -> E: f1
}

-
portPos属性 portPos
节点的 port 属性是指节点连接另一个节点的线条端点位置,端口的位置有8种,分别为节点的东、南、西、北、东南、东北、西南、西北,属性的值分别为e, s, w, n, se, ne, sw, nw
有两种类型的 port 属性:
1. 一种使指定源节点的端点位置,使用 tailport 属性,如下脚本指定 a节点的端点位置为东:digraph G {a -> b [tailport = e]; }
- 一种指定目的节点的端点位置,使用:pos语法,如下脚本指定b节点的端点位置为西:
digraph G {a -> b:w;
}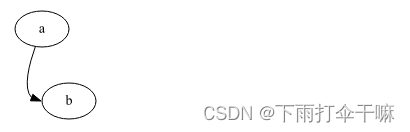
也可以通过上述语法指定 record 形状的域字段(如f1)的端点位置:digraph G {a -> b:f1:w; }其他示例:
digraph G{node[shape = box]c:n -> d[label = n]c1:ne -> d1[label = ne]c2:e -> d2[label = e]c3:se -> d3[label = se]c4:s -> d4[label = s]c5:sw -> d5[label = sw]c6:w -> d6[label = w]c7:nw -> d7[label = nw]
}

tailport和headport与"n",“ne”,“e”,“se”,“s”,“sw”,“w"和"nw”的作用相同
digraph G{node[shape = box]a->b[tailport = n, label = n]a1->b1[tailport = ne, label = ne]a2->b2[tailport = e, label = e]a3->b3[tailport = se, label = se]a4->b4[tailport = s, label = s]a5->b5[tailport = sw, label = sw]a6->b6[tailport = w, label = w]a7->b7[tailport = nw, label = nw]
}

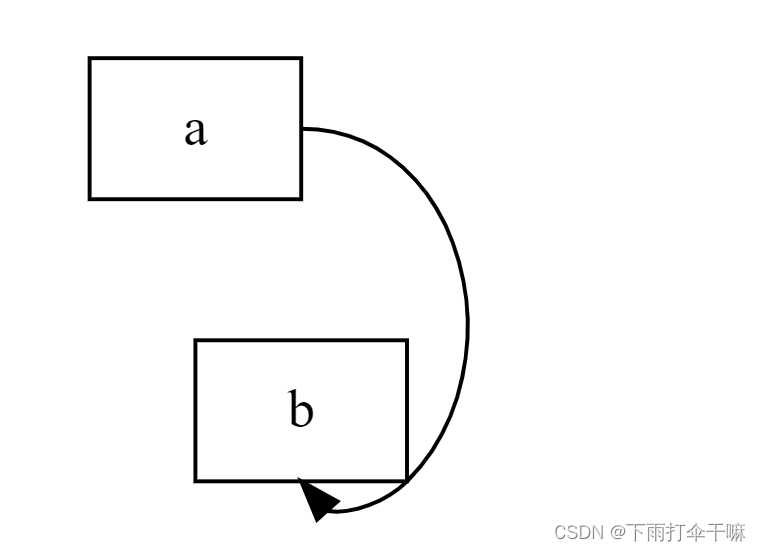
digraph G{node[shape = box]a->b[tailport = e, headport=s]
}
- 设置headlabel、taillabel以及label样式
labelfontcolor设置headlabel和taillabel
fontcolor设置label样式

- 先使用 compound=true,然后就能用lhead和ltail设置连接的子图,将一条边连到一个子图的边界上
使用bgcolor修改背景色
子图的名称必须以cluster开头,否则graphviz无法设别
digraph {compound=true;bgcolor="lightblue";subgraph cluster_a {bgcolor="lightgreen"label="Cluster A";node1; node3; node5; node7;}subgraph cluster_b {bgcolor="lightyellow"label="Cluster B";node2; node4; node6; node8;}node1 -> node2 [label="1"];node3 -> node4 [label="2" ltail="cluster_a"];node5 -> node6 [label="3" lhead="cluster_b"];node7 -> node8 [label="4" ltail="cluster_a" lhead="cluster_b"];
}

- 插入图片
digraph {c[shape = none, image = "./pic.png"]a -> b -> c;c -> d;
}

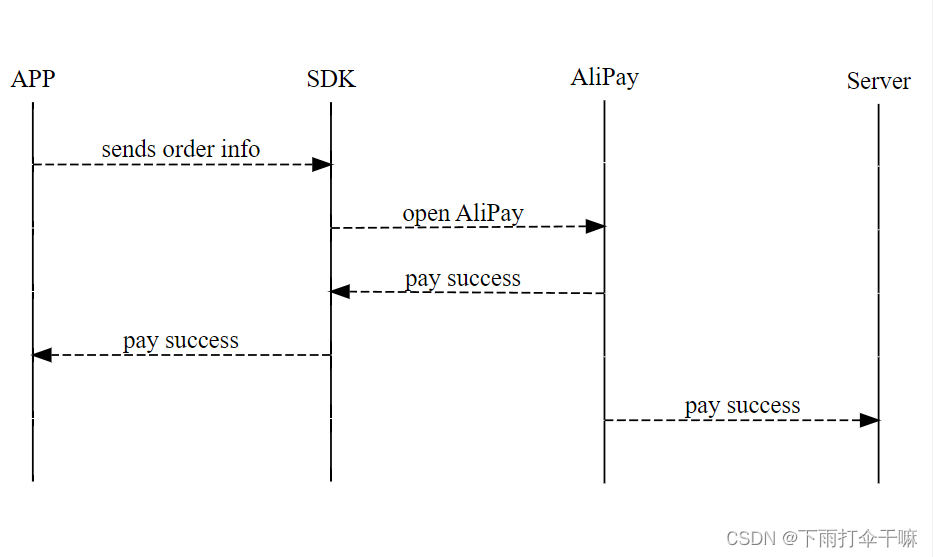
- 时序图
digraph time {rankdir = "LR";node[shape = "point", width = 0, height = 0]edge[arrowhead = "none", style = "dashed"]{rank = "same"edge[style = "solided"];APP[shape = "plaintext"]; // 将 APP 这个节点以 plaintext 的形式展现出来,其他的依旧是 pointAPP -> step00 -> step01 -> step02 -> step03 -> step04 -> step05;}{rank="same";edge[style="solided"];SDK[shape="plaintext"];SDK -> step10 -> step11 -> step12 -> step13 -> step14 -> step15;}{rank="same";edge[style="solided"];AliPay[shape="plaintext"];AliPay -> step20 -> step21 -> step22 -> step23 -> step24 -> step25;}{rank="same";edge[style="solided"];Server[shape="plaintext"];Server -> step30 -> step31 -> step32 -> step33 -> step34 -> step35;}step00 -> step10 [label="sends order info", arrowhead="normal"];step11 -> step21 [label="open AliPay", arrowhead="normal"];step22 -> step12 [label="pay success", arrowhead="normal"];step13 -> step03 [label="pay success", arrowhead="normal"];step24 -> step34 [label="pay success", arrowhead="normal"];
}
- 使用HTML实现一个表格节点实体(注意:html不区分大小写)
更多html-like语法:graphviz官网中对record节点的介绍
digraph html_label_Example
{label = "html_like_label_example";bgcolor="transparent";//背景透明html_ex_node[shape=record, margin=0, label=<<table border="0" cellborder="1" cellspacing="0" cellpadding="4"><tr><td rowspan="2">test</td><td>a</td>                <td rowspan="2">HTML-Like<br/>label</td></tr><tr><td>b</td></tr></table>>];
}

-
style属性
style 属性用于修改节点的外观,当前,支持8种类型的 style:filled, invisible, diagonals, rounded. dashed, dotted, solid, bold- filled : 此值指示应填充节点的内部。使用的颜色是 fillcolor 定义的,若 fillcolor 属性未定义,则使用 color 属性的颜色。对于未填充的节点,节点内部对当前图形或簇背景色的任何颜色都是透明的。请注意,点形状始终是填充的。
digraph G {rankdir=LRnode [shape=box, color=blue]node1 [style=filled] node2 [style=filled, fillcolor=red] node0 -> node1 -> node2
}
- invisible : 不可见。设置此样式会导致节点根本不显示。请注意,节点仍用于布局图形。
digraph G {rankdir=LRnode [shape=box, color=blue]node0 [style=invisible, color=red] node0 -> node1
}
3. diagonals: 斜线 。“斜线”样式会导致在节点多边形的顶点附近绘制小斜线。digraph G {rankdir=LRnode [shape=box, color=blue]node0 [style=diagonals] }
- rounded :圆形的,使节点的边变得圆滑,可以作用在 record 形状上。
digraph R {rankdir=LRnode [style=rounded]node1 [shape=box]node2 [fillcolor=yellow, style="rounded,filled", shape=diamond]node3 [shape=record, label="{ a | b | c }"]node1 -> node2 -> node3
}
- dashed : 使节点的边变为虚线
- dotted : 使节点的边变为点线
- solid : 使节点的边变为直线,默认属性
- bold : 使节点的边线加粗
-
直线曲线
splines=false的情况下,线条都为直线digraph g{splines=false;a->b;b->c;a->c; }
-
线条的链接点
headport 和 tailport取值决定链接点
headclip 和 tailclip取值决定出发点
headclip:如果为true,则将边的头剪裁到头节点的边界。否则,边的末端将剪裁到节点的中心或端口的中心(如果适用)。
tailclip:如果为true,则将边的尾部剪裁到尾部节点的边界。否则,边的末端将指向节点的中心或端口的中心(如果适用)。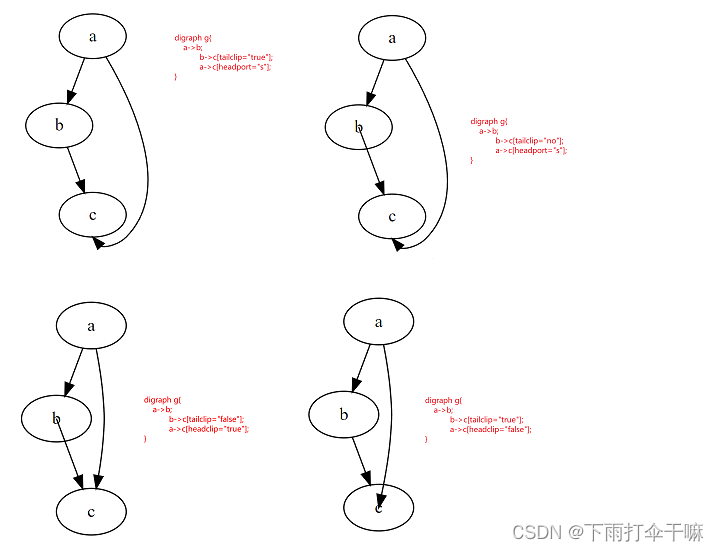
-
是否约束,只划线,不影响节点布局计算
如果为false,则在对节点进行排名时不使用边digraph G {a -> c;a -> b;b -> c [constraint=false];a1 -> c1;a1 -> b1;b1 -> c1 [constraint=true]; }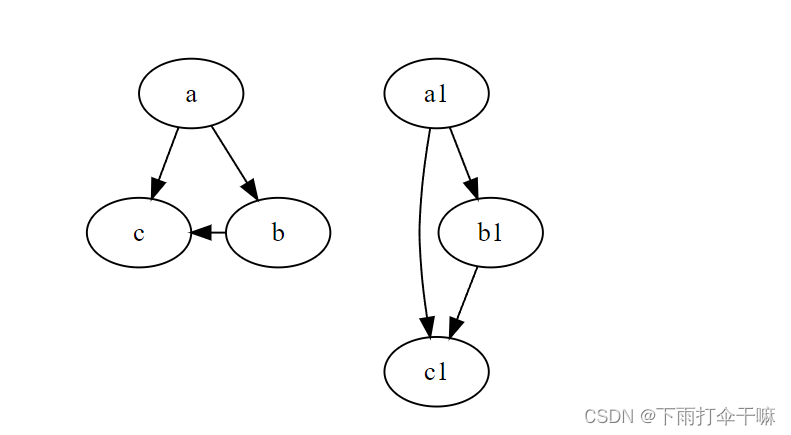
参考文章:
graphviz的基本语法及使用
DOT + graphviz 轻松画图
一小时实践入门 Graphviz
十分钟了解绘图神器——Graphviz学习笔记
转+更新 Graphviz 教程,例子+ 高级应用 写代码,编程绘制架构图(分层拓扑图) 转自官网
Graphviz的使用指南
markdown 绘图利器之graphviz
GraphViz DOT有向图 (六)edge线条控制
这篇关于graphviz的基础使用的文章就介绍到这儿,希望我们推荐的文章对编程师们有所帮助!


